Technical Analysis of Gold for April 7, 2016
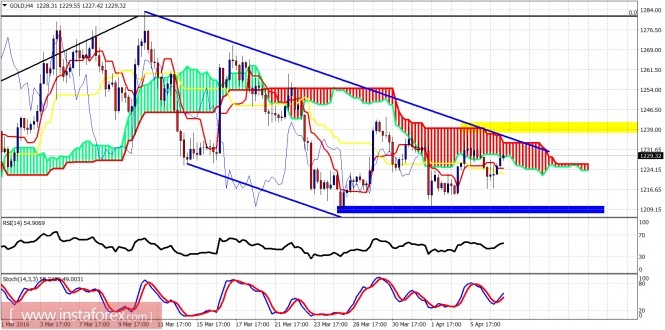
Gold continues to move sideways but is still inside the bearish channel. The trend remains bearish as long as the price is below $1,240 with increased chances of a push lower towards $1,190. If, however, at this stage we do not move towards $1,190 and break above $1,240, there are a lot of chances of making a new high towards $1,300.

Blue lines - bearish channel
Blue area - support
Yellow area - resistance
Gold is below the Kumo (cloud) on the 4-hour chart and is still inside the bearish channel. The trend remains bearish. Short-term support is at $1.215 and short-term resistance is at $1,233. The price is mainly moving sideways but unable to make higher highs.

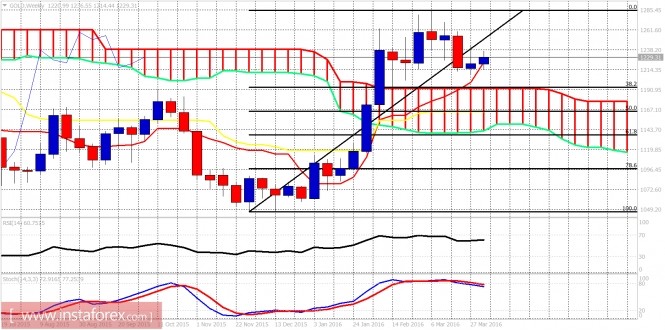
The weekly chart remains fragile with the stochastic oscillator turning lower from overbought levels. However, as long as the weekly candle closes above the tenkan-sen, bulls are in control. As long as the weekly candle closes above $1,223, bulls still have chances for a new higher high.
The material has been provided by InstaForex Company - www.instaforex.com


