Technical Analysis of Gold for April 5, 2016
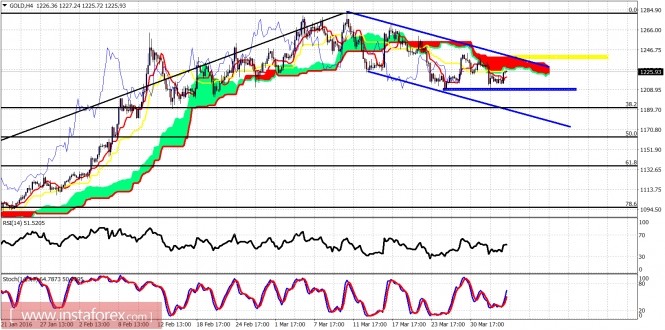
Gold price held above recent low yesterday at $1,207 but remains inside the bearish channel. A new higher high towards $1,300-$1,320 is not ruled out yet as a break above $1,250 will increase the chance of this happening.

Blue lines - bearish channel
Blue area - support
Yellow area - resistance
Gold price remains below the Kumo in the 4-hour chart and the trend remains bearish as long as price is below $1,245-50. Support is set at $1,207 if broken will open the way for a test of the 38% Fibonacci retracement support at $1,190.

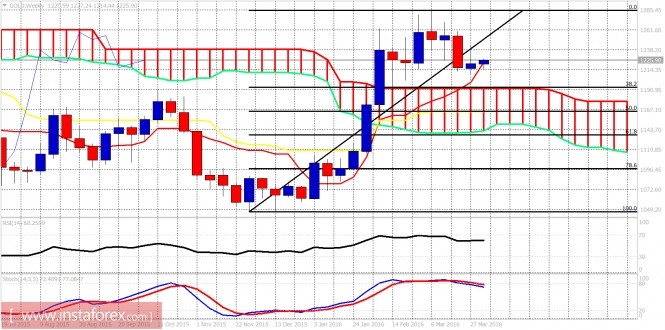
On a weekly basis price remains above the cloud and above the tenkan-sen indicator (red line). We have not reached the 38% Fibonacci retracement yet and therefore the possibility of a new higher high towards $1,300-$1,320 is still there. I remain longer-term bullish but I would prefer to enter long Gold once it pulls back towards $1,150-$1,100 with $1,045 stop.
The material has been provided by InstaForex Company - www.instaforex.com


