Technical Analysis of USD/CAD for March 29, 2016
General overview for 29/03/2016:
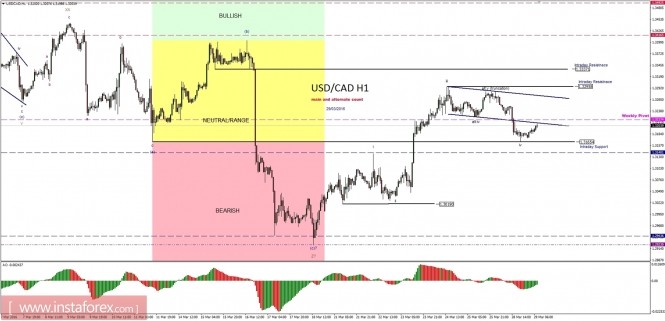
The market is currently trading just below the blue trend line, shy to hit the weekly pivot at the level of 1.3217. The wave progression looks impulsive and it looks like there is one more wave to the upside to be made before any meaningful corrective cycle would develop. On the other hand, the alternative cycle shows the possibility of a truncated wave v at the level of 1.3283 and the beginning of a bigger corrective cycle after that event. The invalidation level for both of these counts is the top of wave iii at the level of 1.3295, but if bears manage to break out below the level of 1.3165 first, then the alternative labeling is fully in play in this market.

Support/Resistance:
13495 - WR2
1.3416 - WR1
1.3337 - Intraday Resistance
1.3295 - Intraday Resistance
1.3217 - Weekly Pivot
1.3165 - Intraday Support
1.3140 - WS1
1.2944 - WS2
Trading recommendations:
Day traders and swing traders should move the SL order for all open buy positions just below the level of 1.3165 and wait for the market reaction. TP is currently still open, but partial take profit might take place at the level of 1.3337.
The material has been provided by InstaForex Company - www.instaforex.com


