USDX Technical Analysis for March 28, 2016
The Dollar index had a strong bullish week however price remains far below the last high at 97.05 and with bearish divergence signals in the short-term a pullback is very likely. The Dollar index is still inside a complex overlapping structure both in the short-term charts and in the medium-term charts. This implies that we are still in a corrective phase and as long as we are above 92, it is still possible that we just consolidate before the next big upward move.

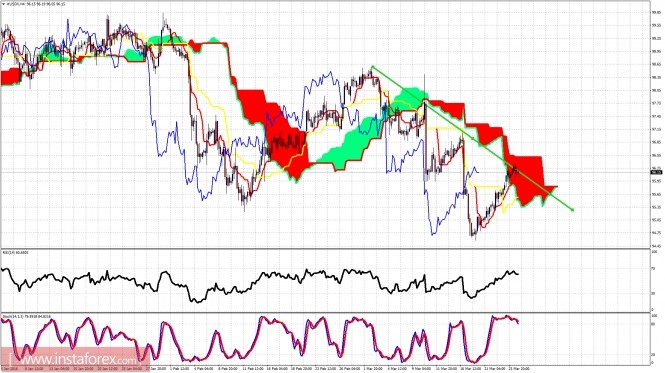
Green line - resistance
Last week the Dollar index rose towards the 4 hour Kumo (cloud) resistance in a straightforward manner. Oscillators have turned overbought and price has not managed to break above the resistance trend line that touches all previous tops. A pause in the uptrend is expected this week. A pullback if not a new lower low is expected.

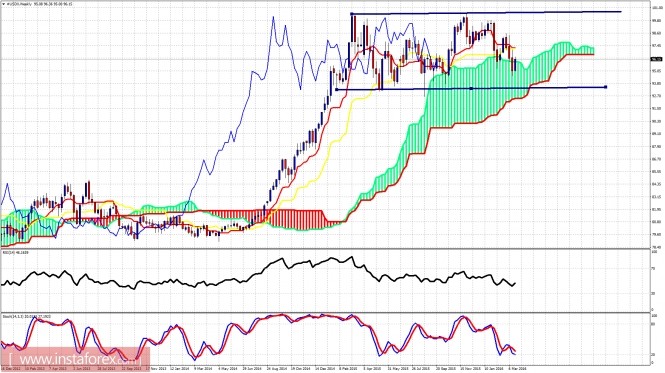
Blue lines - sideways channel for the last year
The weekly candle of last week showed bulls are not giving up yet as price has managed to re-emerge above the upper cloud boundary resistance. Price however still remains inside the long-term sideways channel with no clear direction. Moreover, price is still below the kijun- and tenkan-sen resistance indicators and is still below the weekly high at 98.60. A break above that high will increase the chances of a larger degree breakout to new highs above 103-104.
The material has been provided by InstaForex Company - www.instaforex.com


