USDX Technical Analysis for March 21, 2016
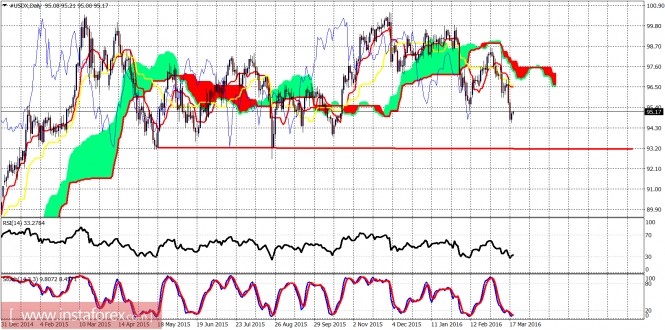
The Dollar index remains in a bearish trend. Price is heading towards the 94-93.50 area. The price formation looks like an important top was formed. The trend resistance is very important at 98.50 and at 97.60.

Red line - horizontal support
The stochastic oscillator is oversold. Price is below the Kumo (cloud). The trend is bearish as price is making lower lows and lower highs. Dollar bears should be cautious as a bounce is imminent. A short-term resistance is at 95.80 while a short-term support is at 94.55.

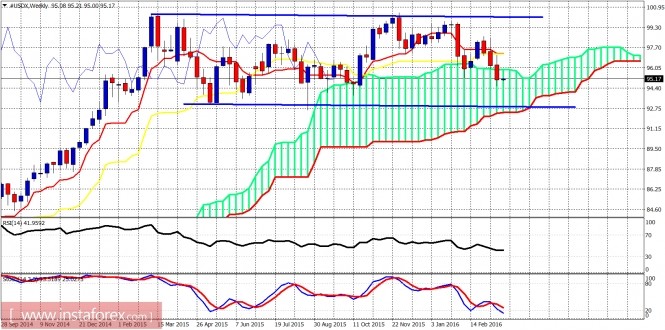
Blue lines - sideways channel
Price remains trapped inside the long-term sideways channel but it is below the Kijun- and tenkan-sen indicators while it has entered inside the Kumo (cloud). This implies that price will be heading towards the lower channel boundary and the lower cloud boundary near 93. The weekly reversal with a lower high 3 weeks ago is a long-term bearish reversal pattern and will be confirmed if we break below 92.50. So long-term Dollar bulls should not ignore the bearish potential of this pattern.
The material has been provided by InstaForex Company - www.instaforex.com


