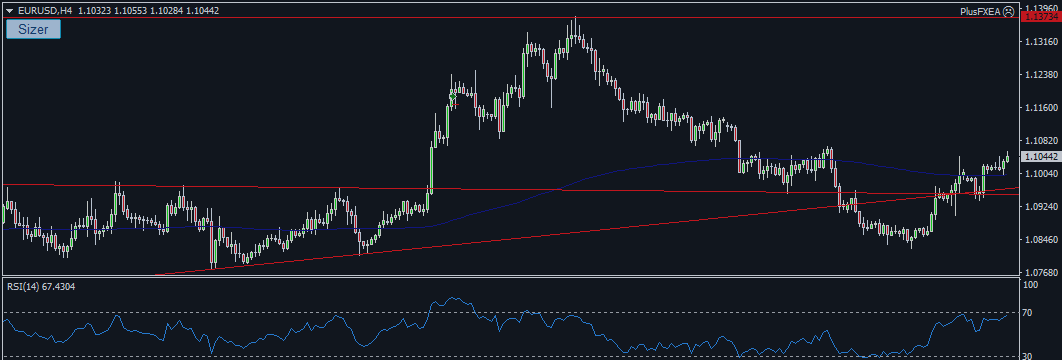
The EUR/USD 4 hour chart shows the price breaking the 200 EMA which may see the price proceed to the previous high at 1.137. However, the RSI is at 67 which is fairly overbought which implies that the movement is running out of momentum.
the lack of momentum does not justify entering into a long trade for the time being. If the price was to carry on increasing then it would target the previous high at 1.137. However, if the price does fall below the 200 EMA then it would open up the chart and target the previous swing low at 1.082.
The daily chart below shows the price is still under the 200 EMA which suggest the price is still in a fairly bearish market. This reinforces the fact that we will not enter into a long position until the direction of the trend is more obvious. This combined with the ECB policy meeting this week which is bound to cause volatility is the reason why we are staying clear of the EUR/USD for the time being.

See www.plusfxtrading.com for more analysis.


