
Morgan Stanley FX Chart Of The Week: Momentum Indicators

In its technical FX chart of the week, Morgan Stanley provides some insights on the current momentum indicators in the FX market.
"The RSI, or relative strength index, looks at the past 14 days of closing prices and measures whether there were more up days relative to down. Latest data indicated that EURSEK momentum is approaching an extreme to the upside, with USDZAR potentially soon approaching an oversold level (below 30).
The past month has seen strong upside in the RSI for AUDUSD, but not yet at overbought levels," MS notes.
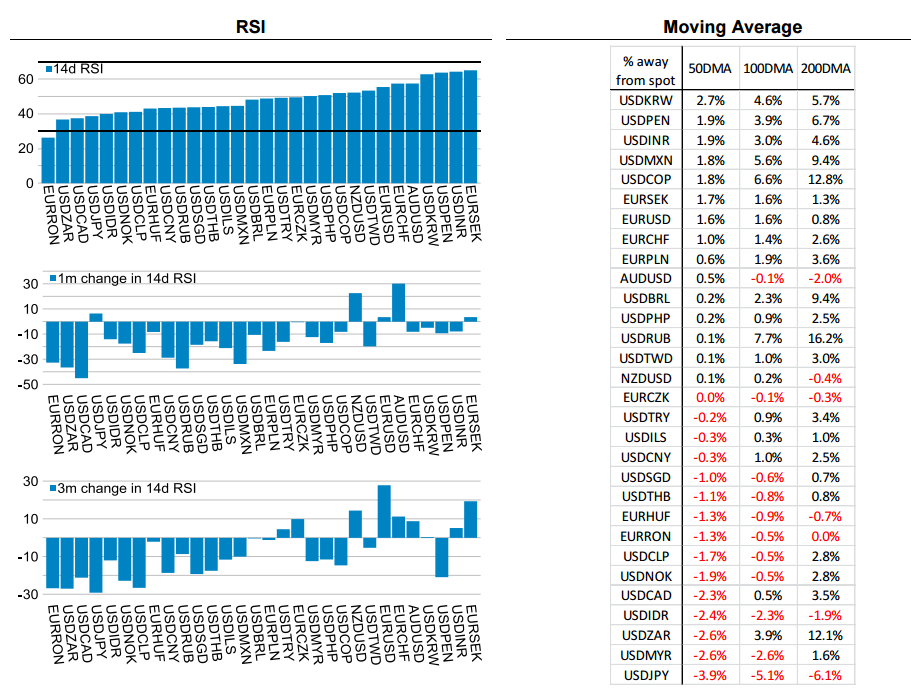
"The FX markets remain volatile with some currencies in particular gaining strong momentum in recent weeks. Looking at moving averages helps to put the moves into context.
USDJPY is now the furthest below the 50, 100 and 200DMA relative to all other pairs. At the other end of the spectrum, EURUSD and EURSEK appear stretched and prone to retrace lower," MS adds.
PS: Copy signals and Earn on Forex4you - https://www.share4you.com/en/?affid=0fd9105


