

Pivot Points
Support & Resistance is a term every technical trader should be familiar with. These technical pricing ceilings and floors can be useful in trading currency pairs or CFD contracts. With a little practice they can be applied to virtually any chart. So today to help you get started, we will look at finding support and resistance using pivot points.
What are Pivot Points?
A pivot point is an indicator that is designed to find support and resistance. The idea is to compare the previous days open, close, high and low prices to identify relevant trading values for today. CFD traders often choose to find support and resistance using pivots, because they are readily available and can be applied to virtually any chart.
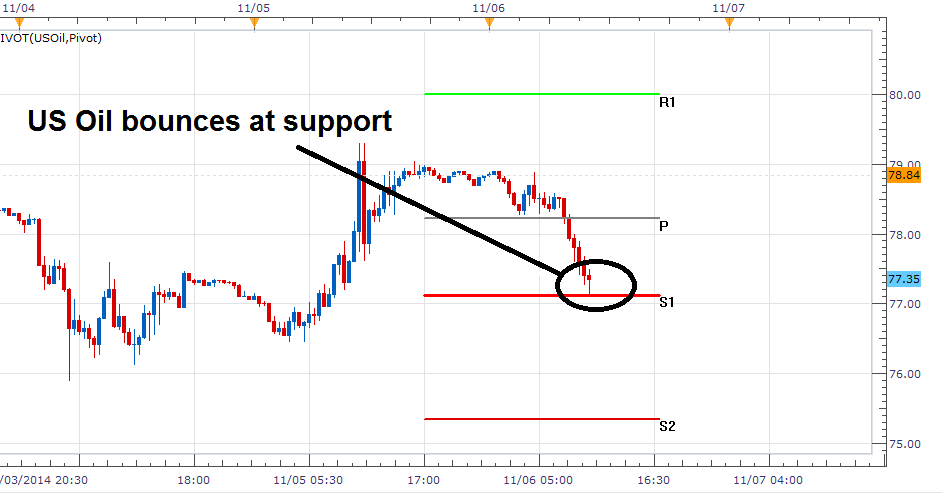
Just like other indicators, CFD traders have options when it comes to choosing pivot points. FXCM’s marketscope 2.0 charting software includes six pivot options including the popular classic, camarilla, and Fibonacci pivots. Each one uses a slightly different calculation, but the concepts are the same. Once applied, traders will watch to see if prices stop at the pivot values or break through them. Below you will see an example of the price of USOil (WTI) being supported at a classic pivot point.
Past performance is no indication of future results.
Trading with Pivots
Once pivots are added to your chart, this brings us to the final question. How do traders trade with pivot points? Typically traders have two options when it comes to trading pivots. Traders can either trade price as it moves between pivot points, or they can wait for a breakout. This leaves traders with an endless variety of strategies. Ultimately whether price bounces or breaks, traders can look to pivots to plan their potential entry orders.
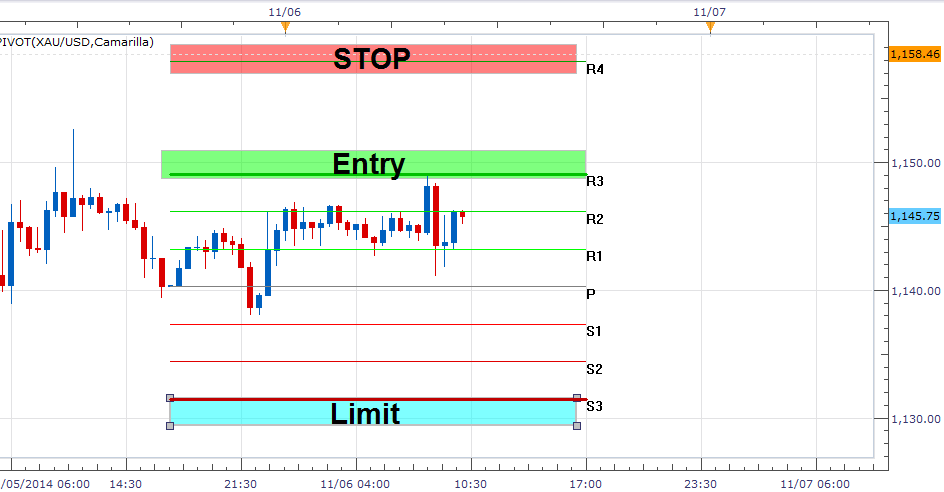
Pivot points can also be used for risk management purposes. Traders can use lines of support and resistance through pivot points to plan their stop and limit order placement. Below is a sample setup for trading gold, (XAU/USD). Traders may plan to enter into the existing downtrend by selling the R3 resistance line. Stop orders can be placed above the market at the next point of resistance, while traders can take profits in the vent price moves to support. Traders may also use the same chart for a breakout scenario. Traders would look to enter the market beneath the S4 pivot point. Stops could then be set back inside of the trading range, with limits targeting an extension of the range on the creation of a lower low.
Practice with Pivots
As you can now see, pivots are easy to use technical tools that can be worked into any trading strategy. To familiarize yourself with them, try adding pivots to your favorite CFD and currency charts. Practicing with an indicator is the best way to learn it and incorporate it into your trading strategy. Most brokers offer CFD demo accounts. This will allow you a chance to get comfortable with the market as well as apply your pivot point trading techniques in real time.


