
USDJPY Technical Analysis 2015, December: ranging within reversal levels with the bullish triangle pattern to be broken

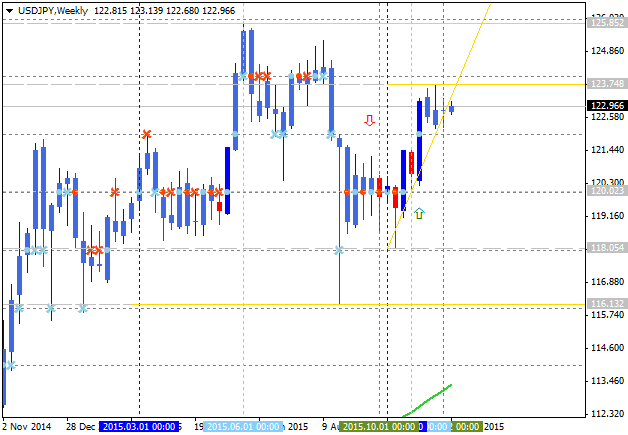
The price is on bullish market condition for breaking 123.74 resistance level for the bullish trend to be continuing with 125.85 as the next bullish target.
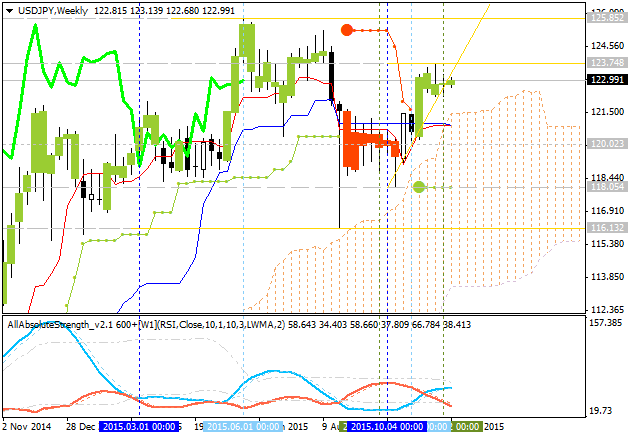
W1 price is on primary bullish market condition:
- The price is located to be above Ichimoku cloud/kumo and Sinkou Span line (which is the virtual border between the primary bullish and the primary bearish on the chart) for the bullish market condition.
- Sinkou Span line is located to be near and below the price which makes the reversal of the price movement from the primary bullish to the ranging bearish market condition to be likely in the next future.
- Ascending triangle pattern is going to be broken to above for good possible breakout.
- Tenkan-sen
line is almost coincided with Kijun-sen line on the chart which is indicating
the ranging condition to be continuing.
- Chinkou Span line crossed the price from below to above for the bullish trend.
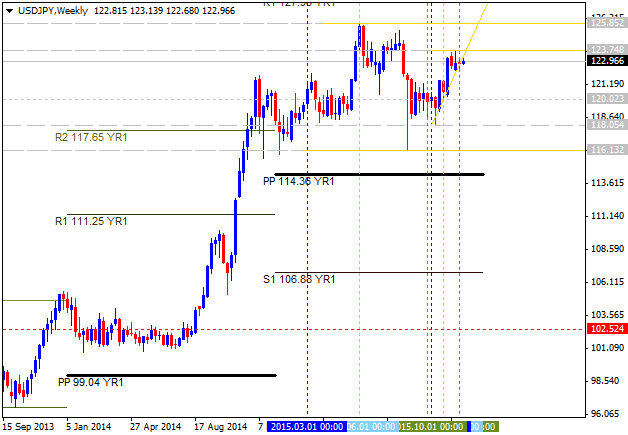
- Nearest support levels are key support level at 116.13, psy support level at 114.00 and Central Pivot at 114.36.
- Nearest resistance levels are 123.78, R1 Pivot at 127.96 and 125.85.
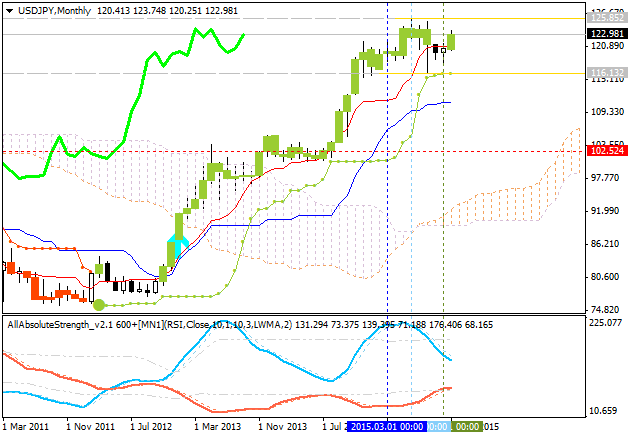
MN price is on bullish ranging within 125.85 resistance and 116.13 support levels. Bearish reversal level for monthly price is 102.52: if the price breaks this level to below so the global bearish reversal for this pair will be started.
If W1 price will break 116.13
support level so the reversal of the price movement from the primary bullish to the primary bearish market condition will be started with the secondary ranging - the price will be located inside Ichimoku cloud in this case.
If W1 price will break Central Pivot at 114.36 from above to below so the price will be fully reversed to the bearish condition.
If W1 price will break resistance level at 123.78 so the bullish triangle pattern will be broken with 125.85 as the next bullish target.
If W1 price will break 125.85
resistance level from below to above so the bullish trend will be continuing with the good possibility to breakout in this case.
If not so the price will be ranging within the levels.
- Recommendation for long: watch close W1 price to break 125.85 for possible buy trade
- Recommendation
to go short: watch W1 price to break 116.13 support level for possible sell trade
- Trading Summary: ranging bullish
| Resistance | Support |
|---|---|
| 123.78 | 116.13 |
| 125.85 | 114.36 |
| 127.96 | 114.00 |
TREND : ranging


