
Quick Technical Overview - Dollar Index: breaking R2 Pivot for the nearest bullish target
16 November 2015, 15:11

0
934
Societe Generale made a fundamental forecast telling the the peak for Dollar Index (the highest value) will be in late 2016 or early 2017. Let's evaluate this forecast with the technical point of view.
Weekly price is on bullish market condition for ranging between R1 Pivot at 95.23 and key resistance level at 100.39. The price is breaking R2 Pivot at 99.31 from below to above for the 100.39 as the next bullish target.
| Instrument | S1 Pivot | Yearly PP | R1 Pivot | R2 Pivot |
|---|---|---|---|---|
| DXY |
82.99 |
87.07 |
95.23 | 99.31 |
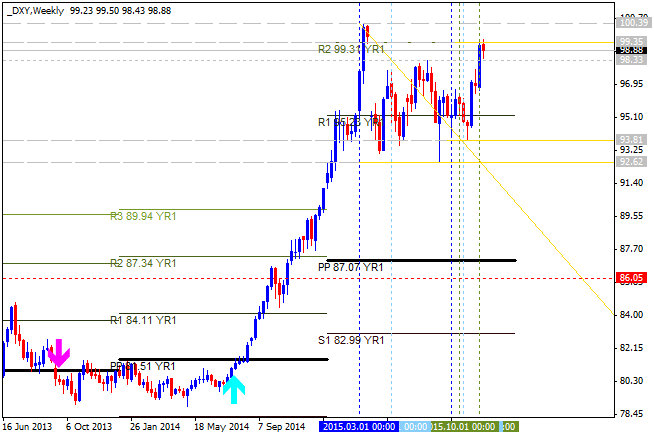
If W1 price will break R2 Pivot at 99.31 on close W1 bar so the primary bullish trend will be continuing up to key resistance level at 100.39.
If W1 price will break resistance level at 100.39 so we may see the bullish breakout.
If not so the price will be ranging between the levels.
Trend:


