
USD/CAD: End Of Week Technicals - daily/weekly breakout; monthly bullish reversal
12 November 2015, 14:00

0
884
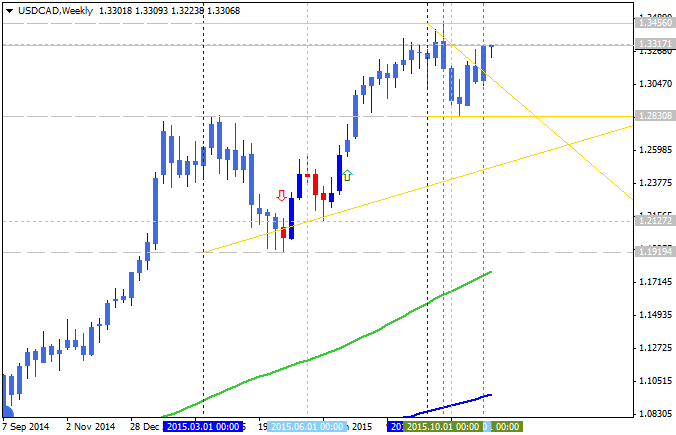
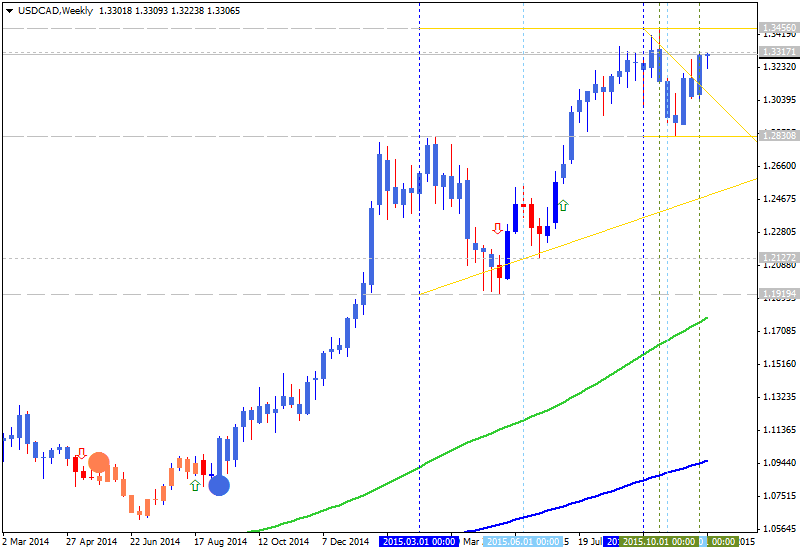
Weekly price
is on primary bullish market condition for the ranging within 1.3456 resistance level and 1.2830 support level:
- The price is located to be far above 100 period SMA (100 SMA) and 200 period SMA (200 SMA) for the primary bullish condition.
- 100 SMA is above 200 SMA for the bullish trend to be continuing.
- Symmetric pattern was broken by the price to above with 1.3456 as the nearest bullish target.
- The nearest support levels for the pair are 1.2830 and 1.1919.
- The nearest resistance levels for the pair are 1.3317 and 1.3456.
If the price breaks 1.3456 resistance level so the primary bullish trend will be continuing.
If the price breaks 1.2830 support level so we may see the local downtrend as the secondary correction within the primary bullish market condition.
If the price breaks 1.1919 support level so the price will be started to be reversed from the
primary bullish to the primary bearish condition with the secondary
ranging.
If not so the price will be moved within the levels.
- Recommendation for long: watch close the price to break 1.3456 for possible buy trade
- Recommendation
to go short: watch the price to break 1.2830 support level for possible sell trade
- Trading Summary: bullish
| Resistance | Support |
|---|---|
| 1.3317 | 1.2830 |
| 1.3456 | 1.1919 |
SUMMARY : bullish


