
FTSE 100 Index Outlook for September - correction to bearish breakdown
4 September 2015, 18:11

0
1 378
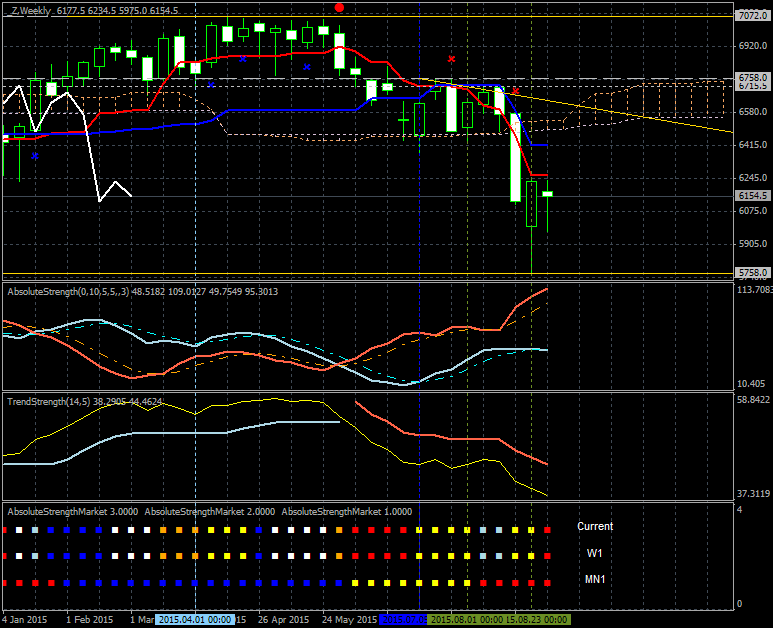
W1 price is on bearish market condition - the price was stopped by 5758.0 support level for the primary bearish trend to be continuing. For now, the price is located below Ichimoku cloud between the following key levels:
- 7072.0 key resistance level located far above Ichimoku cloud; if the price breaks this level from below to above so we may see the bullish breakout of the price movement.
- 6758.0 key resistance level located near the last Ichimoku border line (Senkou Span A) between the primary bearish and the primary bullish area on the chart; if the price breaks this level from below to above so we may see the reversal of the price movement to the bullish market condition.
- 5758.0 key support level located far below Ichimoku cloud in the bearish area of the chart; if the price breaks this level from above to below so the bearish trend will be continuing.
Chinkou Span line is located below the price indicating the bearish trend by the direction.
If W1 price will break 5758.0
support level so the bearish trend will be continuing.
If W1 price will break 6758.0 resistance level so we may see the reversal of the price movement to the bullish market condition.
If W1 price will break 7072.0 resistance level so we may see the bullish breakout of the price movement.
If not so the price will be ranging between the levels.
Trend:


