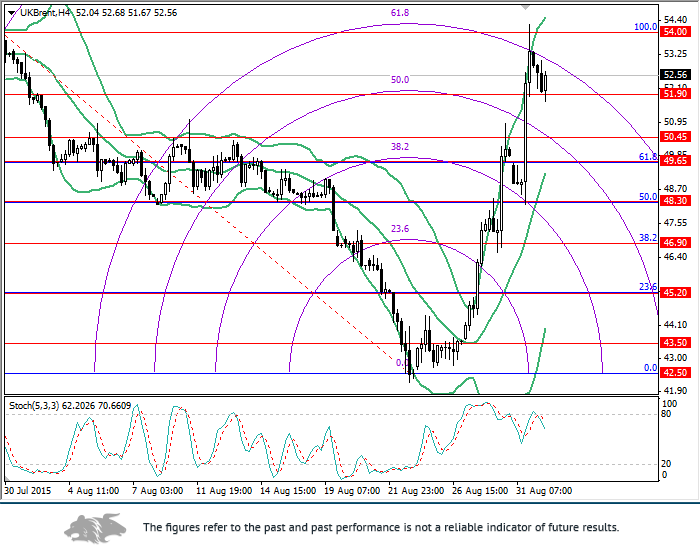
A downward correction can continue.
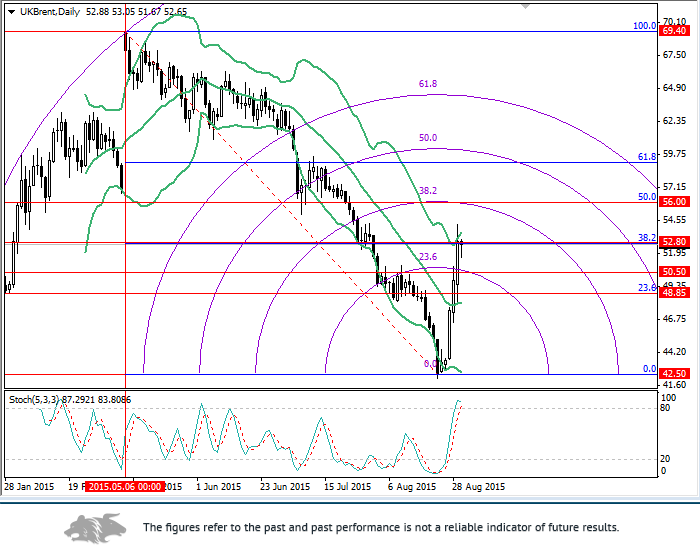
On the 4-hour chart, the price of Brent crude oil tested 100% Fibonacci (54.00) and started a correction from the 61.8% arc. The next targets are 50.45 (a crossover with the 50% arc) and 49.65 (61.8% Fibonacci). A similar picture is on the daily chart, where the price is testing 38.2% Fibonacci (52.80). Its breakdown would allow for a further fall towards 50.50 (a crossover with the 23.6% arc) and 48.85 (23.6% Fibonacci). At the same time, if the price rebounds from the level of 52.80, an upward movement can resume towards the level of 56.00 (50% Fibonacci).
Trading tips
Open short positions below the level of 51.90 with targets at 50.45, 49.65 and stop-loss at 53.00.
Alternative scenario
Long positions can be opened after the price consolidation above the level of 54.00 with the target at 56.00 and stop-loss at 53.30.