
Technical Analysis for NZDUSD - bear market rally on weekly price with forming retracement pattern for uptrend
20 April 2015, 12:11

0
383
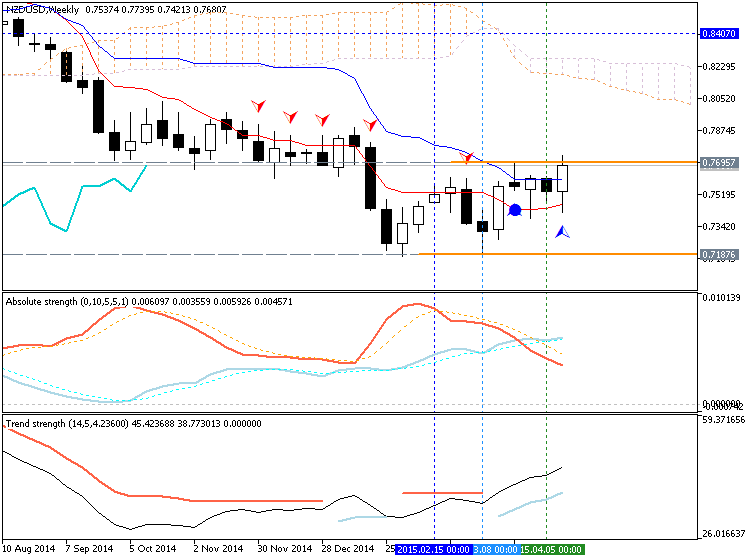
- Chinkou Span line of Ichimoku indicator is going to be crossed weekly price from below to above for good possible breakout of the price movement within the primary bearish
- nearest support level 0.7187 and nearest resistance level is 0.7695 on W1 timeframe
- AbsoluteStrength indicator and TrendStrength indicators are in blue color indicating possible local weekly uptrend (bear market rally).
- “NZDUSD traded to the 61.8% retracement of its 3 year range today (.7929) and the next level of interest probably isn’t until the 2013 Labor Day gap at .7722. One can’t help but notice that an epic double top is possible with a target of .5898. That would trigger on a drop below .7370.”
- "The NZDUSD double top has failed to this point but slope resistance comes into play more or less at the current level and near .7800".
- Monthly Retracement pattern for uptrend was formed with 0.7175 support level and 0.7973 resistance level.
- D1 price is on breakout for trying to cross 0.7697 resistance level on open bar for the breakout to be continuing.

Trend:
- H4 - bullish
- D1 - bullish breakout
- W1 - bear market rally
- MN1 - ranging bearish


