

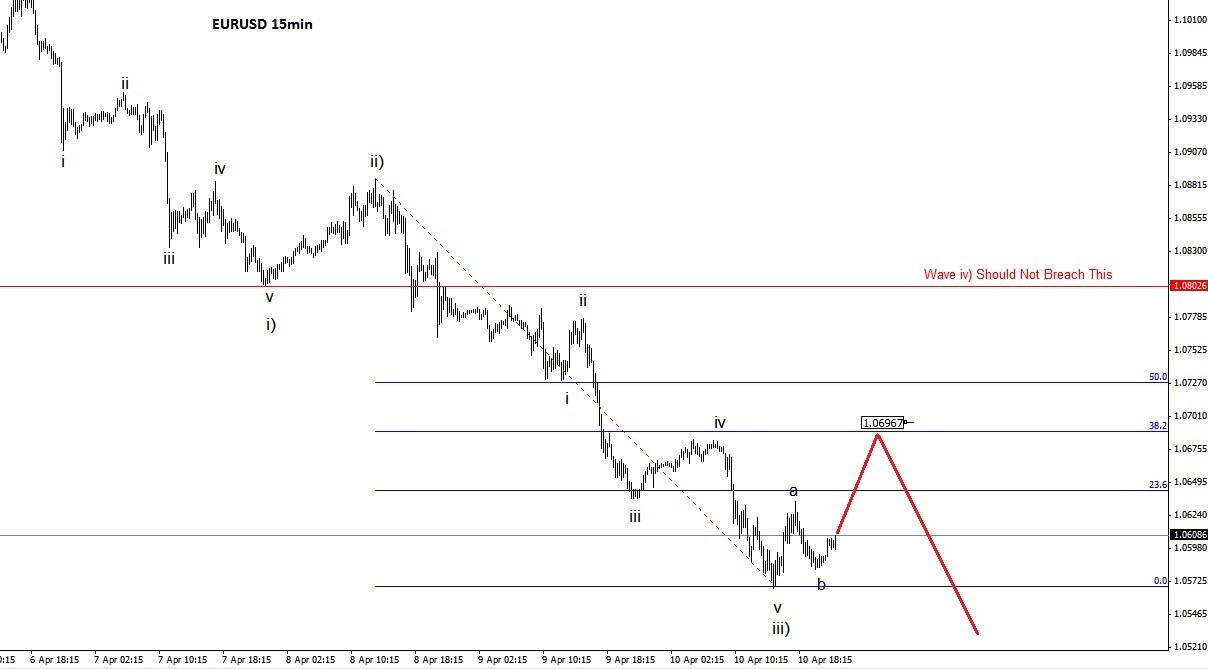
Let's get to some good old fashioned wave counting. The EURUSD is in a clear downtrend, however the 15min chart suggests modestly higher levels when the session starts Sunday afternoon (US). This should bring about a good opportunity to sell. Look for Fibonacci and wave iv resistance at 1.0690 for wave iv) to end. It could carry higher, but the rally should be capped at 1.0800, however I doubt it will get that high at all.
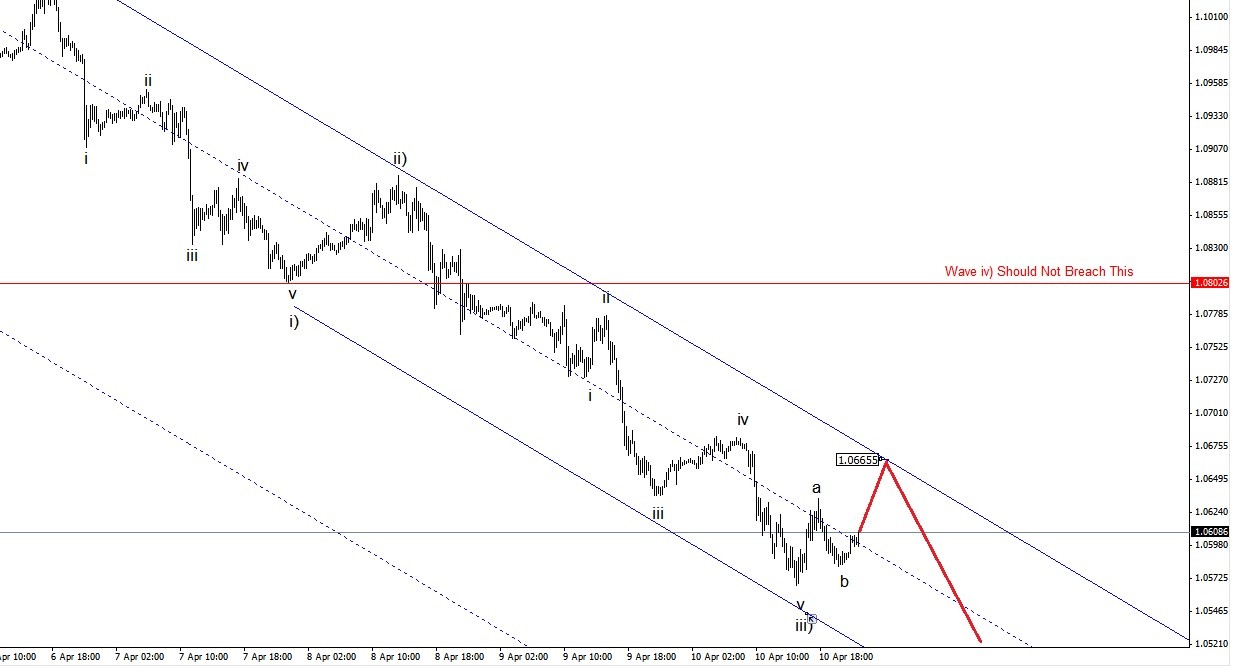
Looking at the Elliott Wave channel we can see that it has held very well so far, so let's also look for this channel to contain the EURUSD rally. There is a confluence of Fibonacci and channel resistance at 1.0640 should this correction higher meander for several hours. If it's a sharp rise right at Sunday's open, then I'll be looking for 1.0670 to contain the rally.
Either way, don't over think this one, the EURUSD remains in a strong downtrend.


