Something to Read - Theory Of Stochastic Processes : With Applications to Financial Mathematics and Risk Theory
This book is a collection of exercises covering all the main topics in
the modern theory of stochastic processes and its applications,
including finance, actuarial mathematics, queuing theory, and risk
theory.
The aim of this book is to provide the reader with the theoretical and
practical material necessary for deeper understanding of the main topics
in the theory of stochastic processes and its related fields.
The book is divided into chapters according to the various topics. Each
chapter contains problems, hints, solutions, as well as a self-contained
theoretical part which gives all the necessary material for solving the
problems. References to the literature are also given.
The exercises have various levels of complexity and vary from simple
ones, useful for students studying basic notions and technique, to very
advanced ones that reveal some important theoretical facts and
constructions.
This book is one of the largest collections of problems in the theory of
stochastic processes and its applications. The problems in this book
can be useful for undergraduate and graduate students, as well as for
specialists in the theory of stochastic processes.
---------
Stochastic is a simple momentum oscillator developed by George C. Lane
in the late 1950’s. Being a momentum oscillator, Stochastic can help
determine when a currency pair is overbought or oversold. Since the
oscillator is over 50 years old, it has stood the test of time, which is
a large reason why many traders use it to this day.
Though there are multiple variations of Stochastic, today we’ll focus solely on Slow Stochastic.
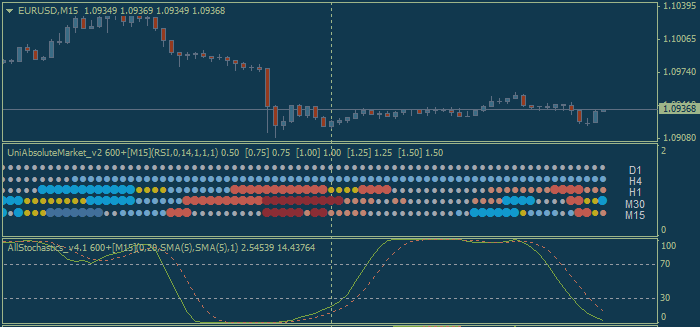
Slow stochastic is found at the bottom of your chart and is made up of
two moving averages. These moving averages are bound between 0 and 100.
The blue line is the %K line and the red line is the %D line. Since %D
is a moving average of %K, the red line will also lag or trail the blue
line.
Traders are constantly looking for ways to catch new trends that are developing. Therefore, momentum oscillators can provide clues when the market’s momentum is slowing down, which often precedes a shift in trend. As a result, a trader using stochastic can see these shifts in trend on their chart.


