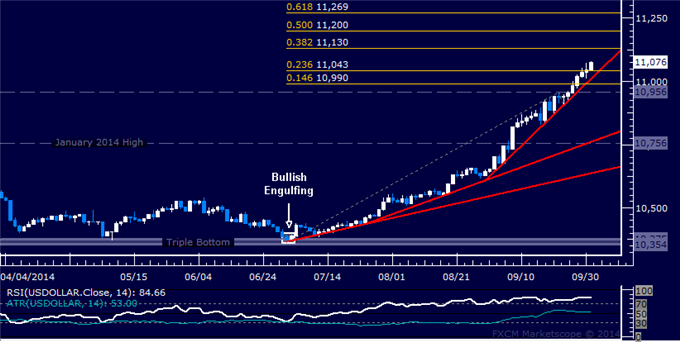
US DOLLAR TECHNICAL ANALYSIS
Prices are extending to a new four-year high. Daily close
above the 38.2% Fibonacci expansion at 11130 exposes the 50% level at
11200. Alternatively, a reversal back below the 23.6% Fib at 11043
clears the way for a test of rising trend line support at 11016.
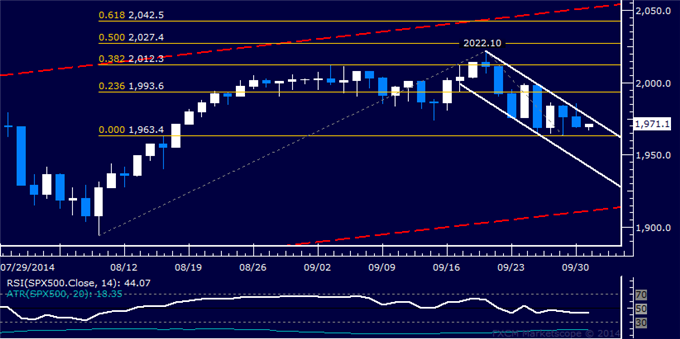
S&P 500 TECHNICAL ANALYSIS
Prices continue to edge lower. Near-term support is 1963.40, the September 29
swing low, with a break below that on a daily closing basis exposing the
channel floor at 1941.60. Alternatively, a move above the channel top
at 1976.60 targets the 23.6% Fibonacci expansion at 1994.60.
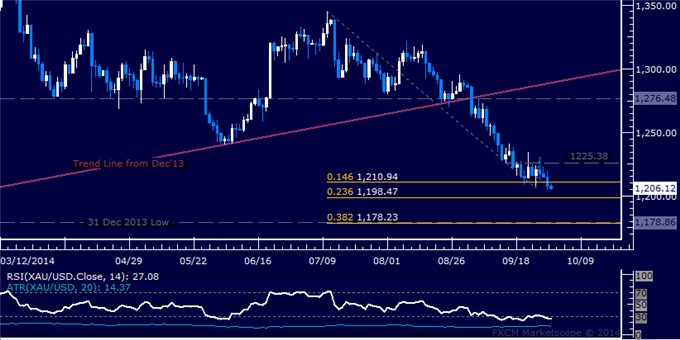
GOLD TECHNICAL ANALYSIS
Prices resumed its down trend after consolidative period, with sellers now aiming to test the 23.6%
Fibonacci expansion at 1198.47. A break below that on a daily closing
basis exposes the 1178.23-86 area marked by the 38.2% level and the
December 31 2013 low. Alternatively, a turn back above the 14.6% Fib at
1210.94 aims for range top resistance at 1225.38.
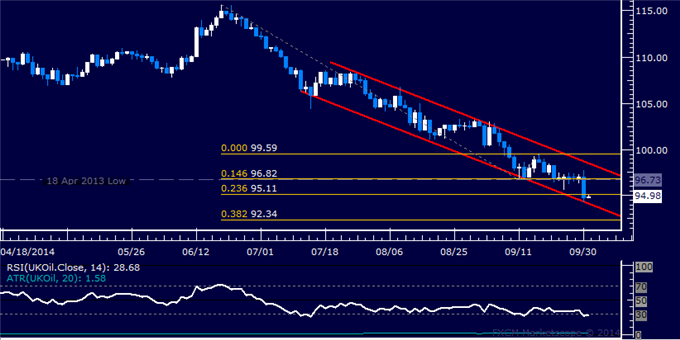
CRUDE OIL TECHNICAL ANALYSIS
Prices edged past support at
95.11, the 23.6% Fibonacci expansion. A break below that exposes the 38.2% level at 92.34.
Alternatively, a turn back above the 95.11 eyes the 96.73-82 area,
marked by the April 18 2013 low and the 14.6% Fib.