
How To Trade - Accumulation/Distribution indicator and How Does It Work

Accumulation Distribution uses volume to confirm price trends or warn of weak movements that could result in a price reversal.
- Accumulation: Volume is considered to be accumulated when the day's close is higher than the previous day's closing price. Thus the term "accumulation day"
- Distribution: Volume is distributed when the day's close is lower than the previous day's closing price. Many traders use the term "distribution day"
Therefore, when a day is an accumulation day, the day's volume is added to the previous day's Accumulation Distribution Line. Similarly, when a day is a distribution day, the day's volume is subtracted from the previous day's Accumulation Distribution Line.
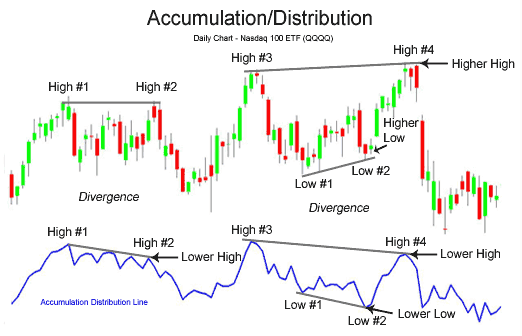
The main use of the Accumulation Distribution Line is to detect divergences between the price movement and volume movement. An example of the Accumulation Distribution Line is shown below in the chart of the Nasdaq 100 exchange traded fund QQQQ:
Volume Interpretation
The basic interpretation of volume goes as follows:
- Increasing and decreasing prices are confirmed by increasing volume.
- Increasing and decreasing prices are not confirmed and warn of future trouble when volume is decreasing.
High #1 to High #2
The Nasdaq 100 made an equal high at High #2; however, the Accumulation Distribution Line failed to make an equal high, in fact it made a lower high. On average, less volume was transacted on the move higher at High #2 than occured on the first move higher at High #1; thus, this could be interpreted as there being less strength and conviction behind the rally in the Nasdaq the second move higher. This failure of the Accumulation Distribution Line signaled a strong bearish divergence.
High #3 to High #4Again, the Accumulation Distribution line made a lower high, even though the Nasdaq 100 this time made a higher high. This bearish divergence warned that the second move to make a higher high in price lacked conviction.
Low #1 to Low #2The bearish divergence from Low #1 to Low #2 confirmed the later bearish divergence of High #3 to High #4. On average, more volume was occuring on down days than up days, even while the Nasdaq 100 was making higher highs and higher lows, which usually is considered a sign of strength.
In summary, the Accumulation Distribution Line is a very effective tool to confirm price action and show warnings of potential price reversals.dsd


