How To Trade - RSI Indicator, Chart Patterns, Trend Lines and How Does It Work
7 May 2015, 21:11

0
5 824
Traders can draw trend lines using RSI indicatorin the same way as trend lines on the price charts. RSI trend lines are plotted as the same way as trend-lines are plotted on the chart; by joining consecutive highs of the RSI Indicator or consecutive lows on the RSI Indicator.
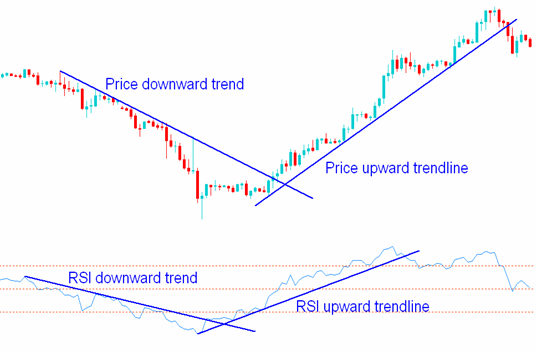
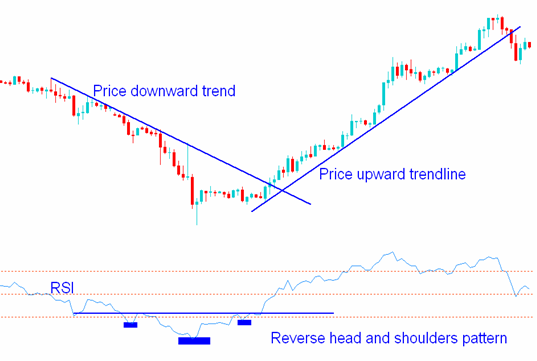
Chart patterns (head and shoulders, or triangle chart patterns) are often formed on the RSI indicator using - RSI indicator forms chart patterns: head and shoulders, triangles and more that may or may not be visible on the price chart. As shown on the chart below the Reverse Head and Shoulders reversal formation is clearly shown on the RSI indicator.
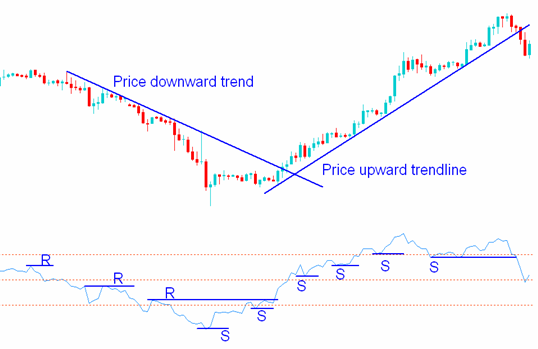
Sometimes levels of support and resistance are demonstrated better on the RSI than on the price chart.
- In an uptrend the support levels
should not be broken at any one time, if they are broken then price
will also break the support levels and the upward trend is going to
reverse.
- In a downtrend the resistance levels should not be broken, if they are broken then price will also break the resistance levels, and the downward is going to reverse.