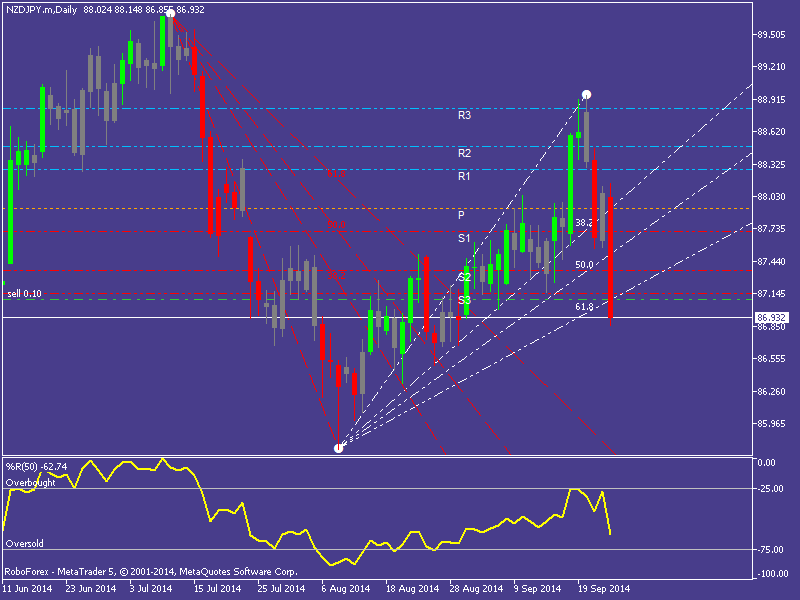
Fundamentals from last night are pushing down NZD. On this daily chart we see that current candle is breaking down either all supports (S1,S2,S3) and also all FIBO's.
Volumes have tested the overbought border zone and now are pointing down to the Oversold one. So a new big downtrend started and if the actual price on chart is confirmed on closing bar we have a good chance to enter short and close position down on a new FIBO formation or new white dot.
Warning: what will happen to prices no one can know, that belongs to the future.
Good Luck!


