NZDUSD Technicals on Weekly Chart
10 August 2014, 22:22
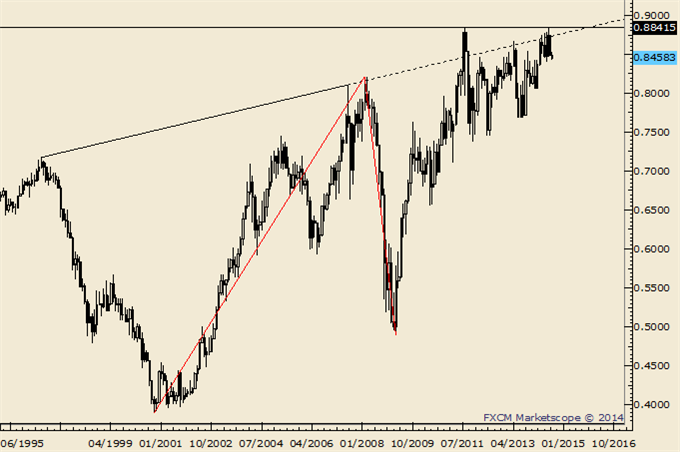
- “Don’t forget about the line that extends off of the 1996 and 2007
highs. That line crosses through the 2008, 2011, and highs as well. In
2011 (record free float high), the rate surged through the line in late
July before topping on August 1st. The rate reversed this week from pips
below the record high and above the mentioned line.”
- NZDUSD weakness from the July high is impulsive, which suggests that
an important high is in place. 5 waves down also warn of a rally
attempt. The current level, defined by the 200 DMA and trendline
support, is a good place for that rally attempt to take place. Above
.8500 is needed in order to suggest that the minor low is in place.