
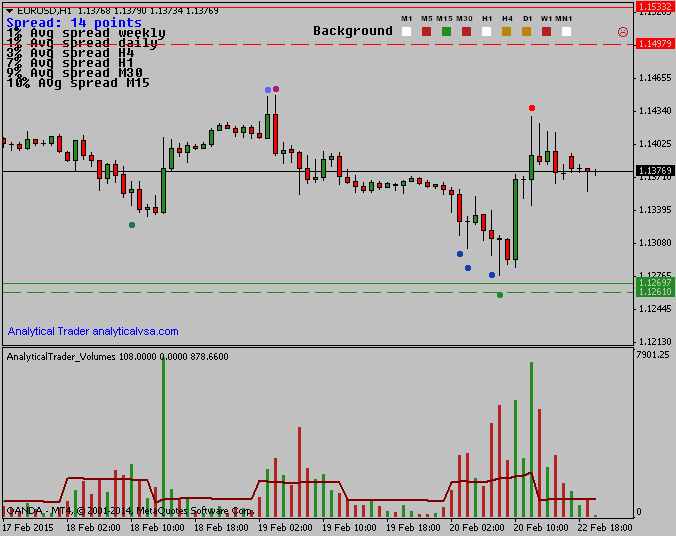
Since 27/January, Euro/US Dollar is in a trading range between 1126 – 1153. We’ve seen very high buying activity near the lower support, and selling on the middle/near the resistance, and now the prices are right in the middle. Looking at the last bars, we had very strong buying, marked by the blue and green dots, which made that last rally surge. But as prices attempted to rally higher, in the last hours of trading on Friday, just by the close of the US session, there was a big volume buying climax that is marked by the red dot.
There was recently significant buying and selling, so what we know is that there are big traders interested in higher prices, and others in lower prices – most probably traders from different timeframes. It’s also possible that the last weak bar was the smart money taking profits, and now they’re waiting for prices to come down again to continue accumulating. So what I’d like to see were prices either approaching the support or the resistance, or even breaking one of them, in order to get a better Risk:Reward and a lesser probability of a whipsaw due to these contradictory and strong trades that took place in the market – then we’ll enter either in what I called the Setup near S/R or the Setup on a break-out.


