Technical Analysis for US Dollar, S&P 500, Gold and Crude Oil - S&P 500 Drops Most in Nearly 4 Months to Test 2000

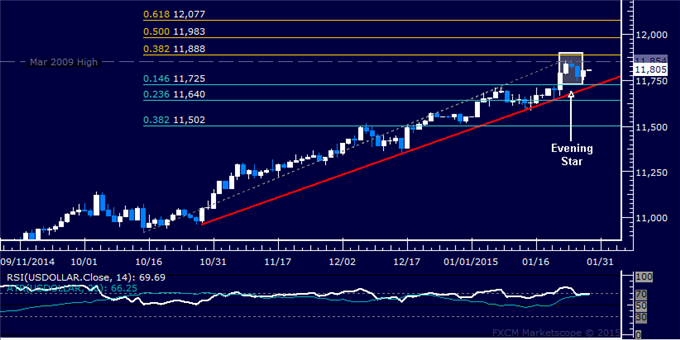
US DOLLAR TECHNICAL ANALYSIS
Prices may be readying to turn
lower after producing a bearish Evening Star candlestick pattern. A
daily close below the intersection of the 14.6% Fibonacci retracement
and a rising trend line at 11725 exposes the 23.6% level at 11640.
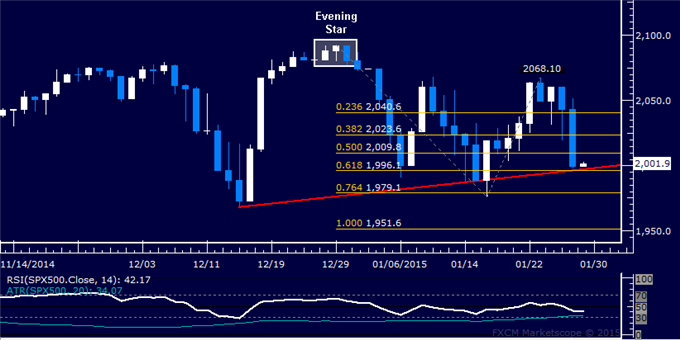
S&P 500 TECHNICAL ANALYSIS
Prices declined as expected
after putting in a bearish Evening Star candlestick pattern. A daily
close below 1996.10, the intersection of the 61.8% Fibonacci expansion
and a rising trend line, exposes the 76.4% level at 1979.10.
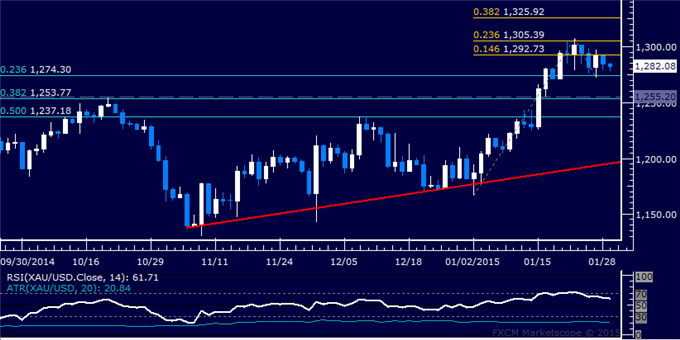
GOLD TECHNICAL ANALYSIS
Prices continue to consolidate after
finding resistance above the $1300/oz figure. A daily close below the
23.6% Fibonacci retracement at 1274.30 exposes the 1253.77-55.20 area
marked by the October 21 high and the 38.2% level. Alternatively, a push
above the 14.6% Fib expansion at 1292.73 targets the 23.6% threshold at
1305.39.
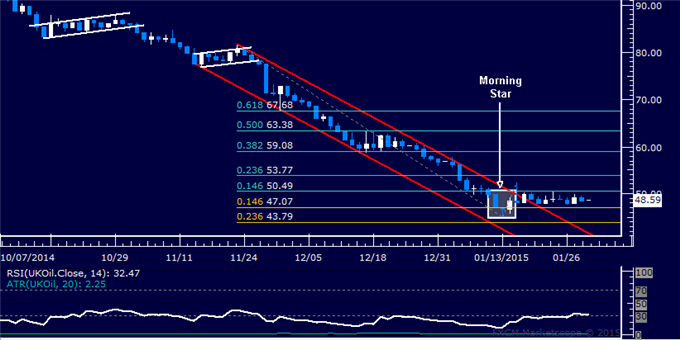
CRUDE OIL TECHNICAL ANALYSIS
Prices are stalling having
attempted to recover as expected. A daily close above the 14.6%
Fibonacci retracement at 50.49 exposes the 23.6% level at 53.77.
Alternatively, a reversal below the 14.6% Fib expansion at 47.07 targets
the 23.6% threshold at 43.79.