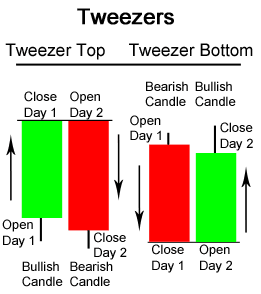
The Tweezer Bottom candlestick pattern is a powerful bullish candlestick reversal pattern.
Tweezer Bottom formation consists of two candlesticks:
- Bearish Candle (Day 1)
- Bullish Candle (Day 2)

Tweezer Bottom occurs during a downtrend when bears
continue to take prices lower, usually closing the day near the lows (a bearish
sign). Nevertheless, Day 2 is completely opposite because prices open and go
nowhere but upwards. This bullish advance on Day 2 sometimes eliminates all
losses from the previous day.
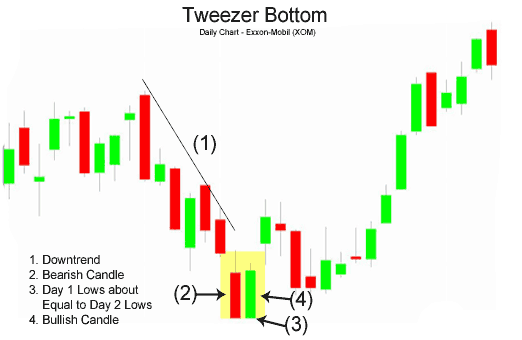
Tweezer Bottom Candlestick Chart Example
The bears pushed the price of Exxon-Mobil (XOM) downwards on Day 1; however, the
market on Day 2 opened where prices closed on Day 1 and went straight up,
reversing the losses of Day 2. A buy signal would generally be given on the day
after the Tweezer Bottom, assuming the candlestick was bullish green.


