Technical Price Pattern Analysis for US Dollar, Gold, Grude Oil and S&P 500

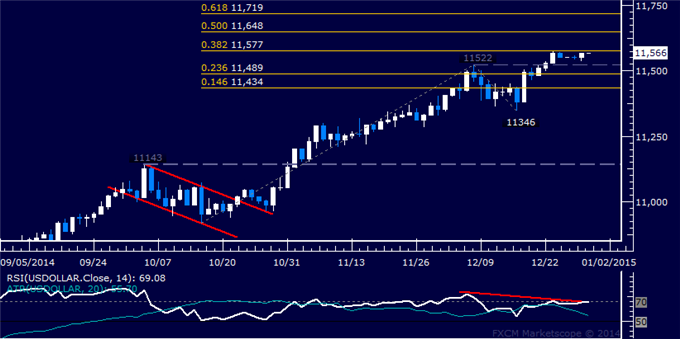
US DOLLAR TECHNICAL ANALYSIS
Prices aredigesting gains near a
five-year high but negative RSI divergence casts doubt on immediate
follow-through. A daily close above the 38.2% Fibonacci expansionat
11577 exposes the 50% level at 11648.
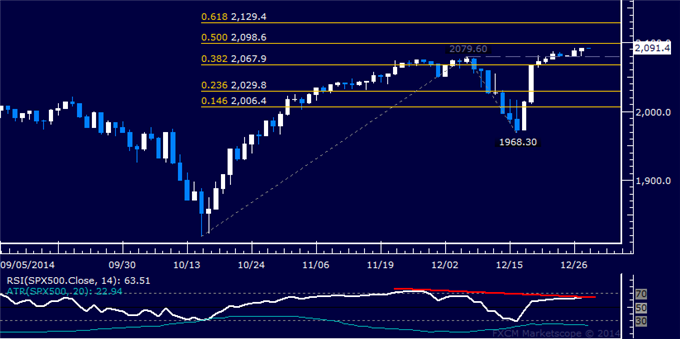
S&P 500 TECHNICAL ANALYSIS
Prices edged above the December 5
high at 2079.60, exposing the 50% Fibonacci expansion at 2098.60. A
daily close above this barrier exposes the 61.8% level at 2129.40.
Negative RSI divergence warns of ebbing upside momentum and hints a turn
lower may be looming. A turn back below 2079.60 sees initially support
at 2067.90, the 38.2% Fib.
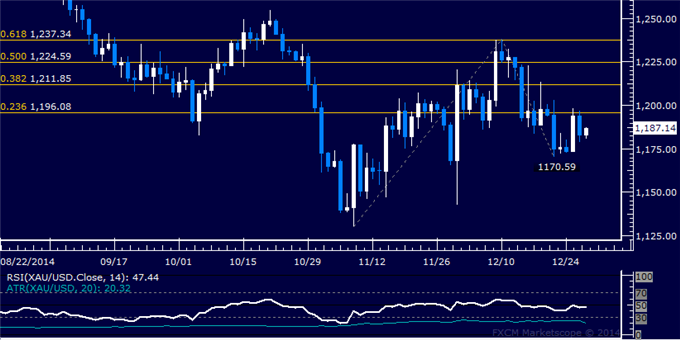
GOLD TECHNICAL ANALYSIS
Prices recoiled upward to test
resistance at 1196.08, the 23.6% Fibonacci expansion, with a break above
that on a daily closing basis exposing the 38.2% level at 1211.85.
Near-term support is at 1170.59, the December 22 low.
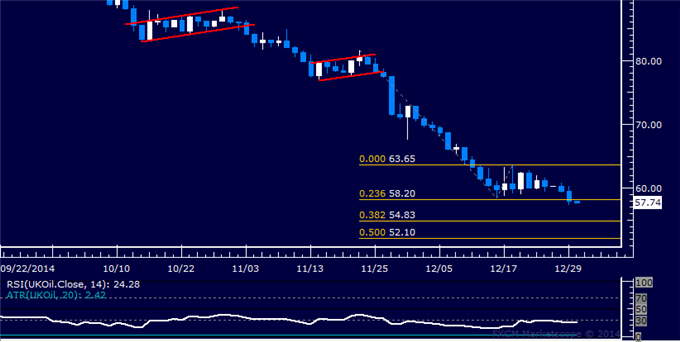
CRUDE OIL TECHNICAL ANALYSIS
Prices narrowly broke support at
58.20, the 23.6% Fibonacci expansion, with sellers now aiming to
challenge the 38.2% level at 54.83. A further push beneath that targets
the 50% Fib at 52.10. Alternatively, a reversal back above 58.50 aims
for the December 18 high at 63.65.