Price Pattern Analysis: Gold Breaks Five-Month Down Trend, S&P 500 May Have Formed a Double Top Below 2100 Figure

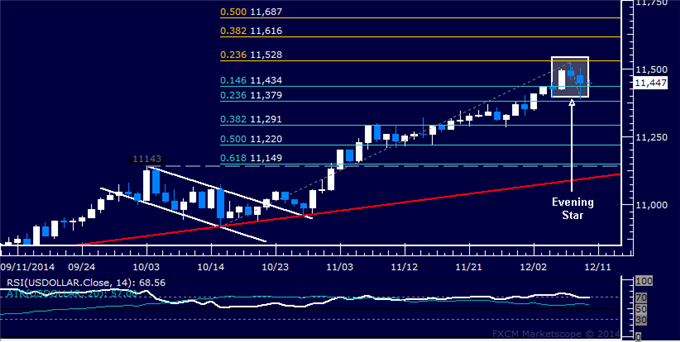
US DOLLAR TECHNICAL ANALYSIS
Prices may be preparing for a
pullback having put in a bearish Evening Star candlestick pattern below a
five-year high. A daily close below the 14.6% Fibonacci retracement at
11434 exposes the 23.6% level at 11379.
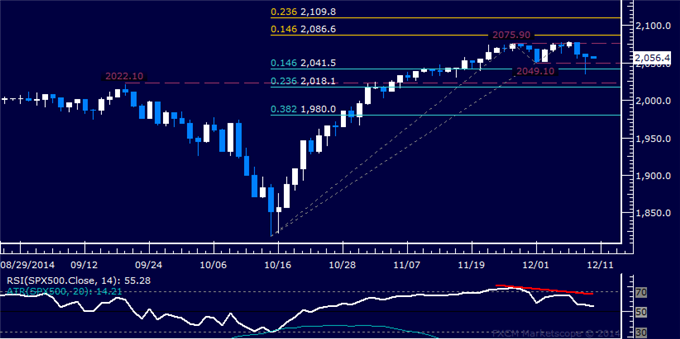
S&P 500 TECHNICAL ANALYSIS
Prices began to turn lower as
expected. A drop below the 2041.50-49.10 area marked by the 14.6%
Fibonacci retracement and the December 1 low exposes the 2018.10-22.10
zone (23.6% level, September 19 high).
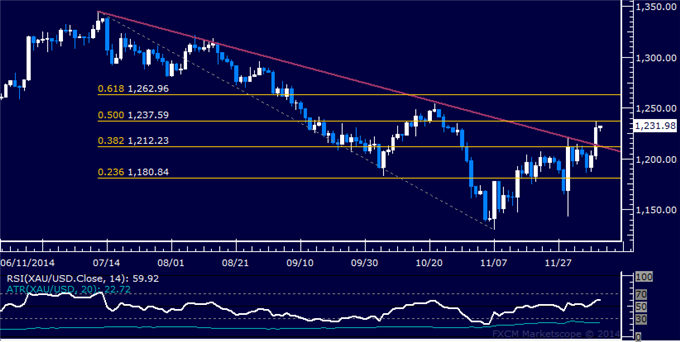
GOLD TECHNICAL ANALYSIS
Prices overcome resistance at a falling
trend line set from early July, exposing the 50% Fibonacci retracement
at 1237.59. A break above this barrier on a daily closing basis exposes
the 61.8% level at 1262.96.
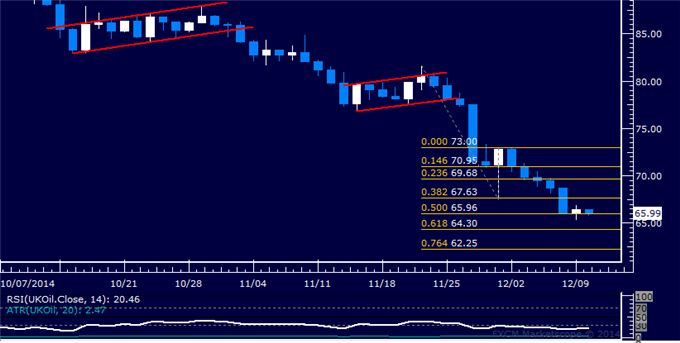
CRUDE OIL TECHNICAL ANALYSIS
Prices paused to consolidate
losses after five consecutive days of downward momentum. A break below
the 50% Fibonacci expansion at 65.96 exposes the 61.8% level at 64.30.