Price Pattern Analysis for US Dollar, S&P 500, Gold and Grude Oil: S&P 500 to Re-Test Support Level, Gold Prices Pull Back After Largest Daily Rally

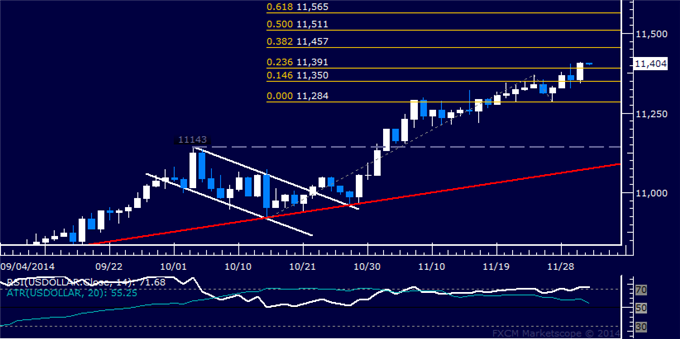
US DOLLAR TECHNICAL ANALYSIS
Prices issued their strongest
close in five years, with prices seemingly poised to continue marching
higher. A daily close above the 38.2% Fibonacci expansion at 11457
exposes the 50% level at 11511.
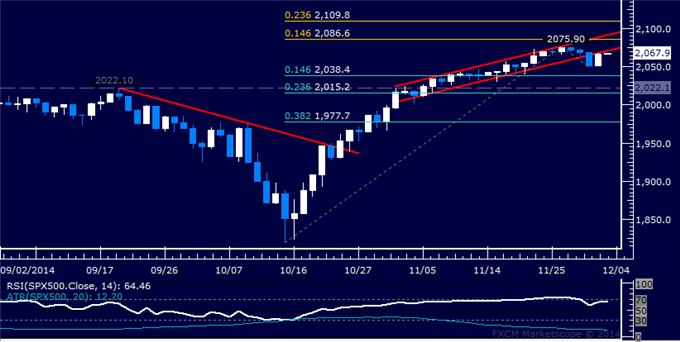
S&P 500 TECHNICAL ANALYSIS
Prices corrected higher after
producing the largest drawdown since mid-October. A break above channel
floor support-turned-resistance at 2071.10 exposes the November 26 high
at 2075.90, followed by the 14.6% Fibonacci expansion at 2086.60.
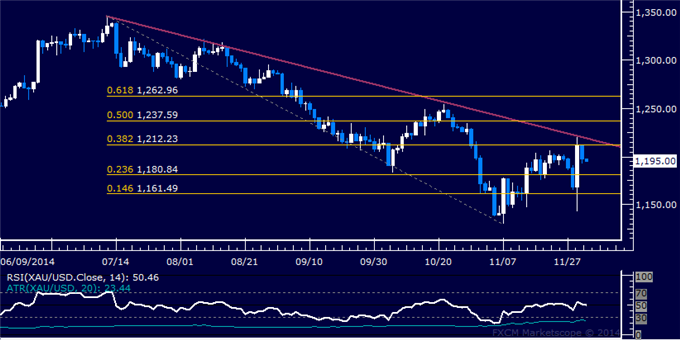
GOLD TECHNICAL ANALYSIS
Prices backed off a bit after producing
the largest daily advance in over two years. Near-term resistance is in
the 1212.23-17.97 area marked by the 38.2% Fibonacci retracement and a
falling trend line set from early July. A break above this barrier
exposes the 50% level at 1237.59.
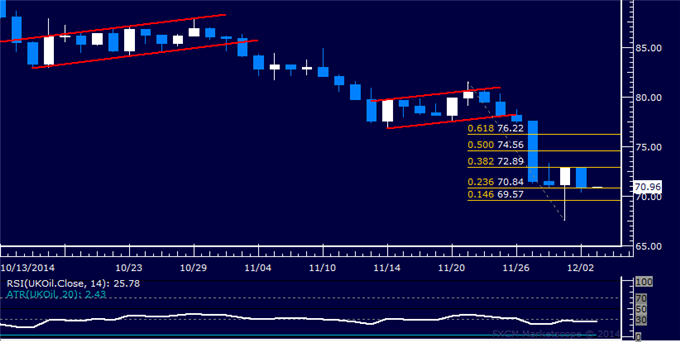
CRUDE OIL TECHNICAL ANALYSIS
Prices are in consolidation move
above the 70.00 figure. A daily close below the 23.6% Fibonacci
retracement at 70.84 exposes the 14.6% level at 69.57.