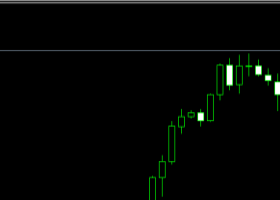
- NZD/USD Technical Strategy: Flat
- Support: 0.8330, 0.8283, 0.8206
- Resistance:0.8401-34, 0.8511, 0.8553-73

Prices are too close to resistance to justify entering long from a risk/reward perspective. On the other hand, the absence of a defined bearish reversal signal suggests taking up the short side is premature. With that in mind we will remain flat for now.
If we look at Ichimoku chart for W1 timeframe so Chinkou Span line of Ichimoku indicator is crossing the price on open bar from above to below which is indicating the future possible breakdown with the reversal of price movement from primary bullish to primary bearish market condition: if the price will break 0.8310 support level - we may see this reversal with the ranging market condition within primary bearish for example.


