

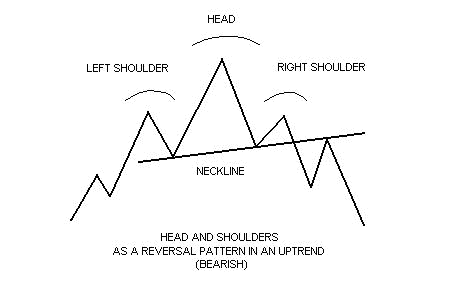
The head and shoulders pattern is thus seen as a potential reversal pattern and day traders will pay special attention to this pattern when it occurs on an uptrend, and will look to trade a potential reversal of the uptrend should the pattern play out. For further confirmation that the potential for a reversal is high traders often give more credibility to a falling neckline than they do a rising neckline.
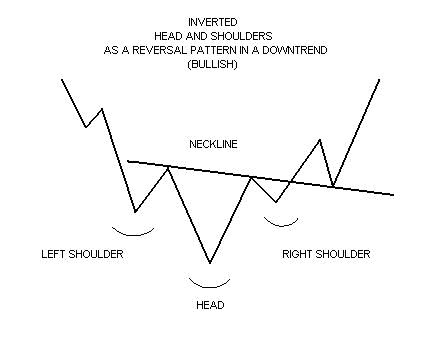
The reverse head and shoulders is basically a mirror image of the head and shoulders pattern and is defined by one trough, followed by a second lower trough, which is then followed by a third higher trough, and then finally a break above the resistance level established by the two peaks formed by the pattern.
the reverse head and shoulders is basically showing the sellers trying 3 times unsuccessfully to take the market lower before finally giving into the buyers who theoretically retain control after the 3rd failure. Like the Head and Shoulders Pattern, the Reverse Head and Shoulders is seen as a reversal pattern, and traders of the stock, futures and forex markets will pay special attention to this pattern when it occurs as part of a downtrend should the pattern play out. For further confirmation that the potential for a reversal is high, day traders will look for a rising neckline.
Upon the break of the neckline support level the chart pattern is said
to be in place so this is where traders will commonly look to enter a
short position. Their target will be calculated by measuring the
distance from the head of the pattern down to the neckline and then
projecting that distance downward from the breakpoint of the neckline.
The stop will then be placed just above the right hand shoulder of the
pattern which is considered resistance. The idea here is that once the
neckline support has been broken sellers will theoretically remain in
control but if this does not happen then you are protected with a stop
loss just above the nearest resistance level.
For the reverse
head and shoulders the strategy is a mirror image of the above. Upon the
break of the neckline resistance the pattern is said to be in place so
traders will commonly look to buy at this level. Just as with the head
and shoulders their target will be calculated by measuring the distance
between the head and the neckline but in this case the target is
projected upward from the break point of the neckline. The stop will
then be placed just above the right had shoulder of the pattern which is
in this case considered the nearest support level.
For
confirmation, traders will commonly look for a downward sloping neckline
before entering a trade on the break of a head and shoulders pattern
and an upward sloping neckline before entering a trade on the reverse
head and shoulders, as this is further indication that the trend is
reversing. Secondly traders like to see the volume on the second peak
(trough with a reverse head and shoulders) be lower than the volume on
the first, and the volume on the third peak (trough in a reverse head
and shoulders) be lower than the volume on the second peak as this is
further confirmation that the trend is ready to reverse. Lastly they
will look for increasing volume on the break of the neckline to show
that the break is real.
That's our lesson for today. You should
now have a good understanding of the head and shoulders pattern and the
reverse head and shoulders pattern as well as a trading strategy for
each of them. In our next lesson we are going to finish up on reversal
patterns by looking at the rising wedge and falling wedge patterns and
then we will move onto continuation patterns after that.


