
In this article I will provide my view on the EUR/USD, EUR/GBP, NZD/USD, NZD/CAD, CAD/JPY and the GBP/CAD. These are the pairs that I am currently interested in or was interested in last week for trading with the Hybrid Grid strategy. The total amount of pairs are a lot and several of them have been discussed in the last few weeks. I will pick one to analyse in more detail from the pairs that have not been discussed yet recently.
- All trades are based on specific rules according to the FxTaTrader Hybrid Grid strategy.
- All open positions can be viewed by clicking here.
This articles will provide:
- The weekly currency chart for the interesting pairs.
- The daily(timing) chart for the interesting pairs.
- Possible positions for the coming week and positions taken.
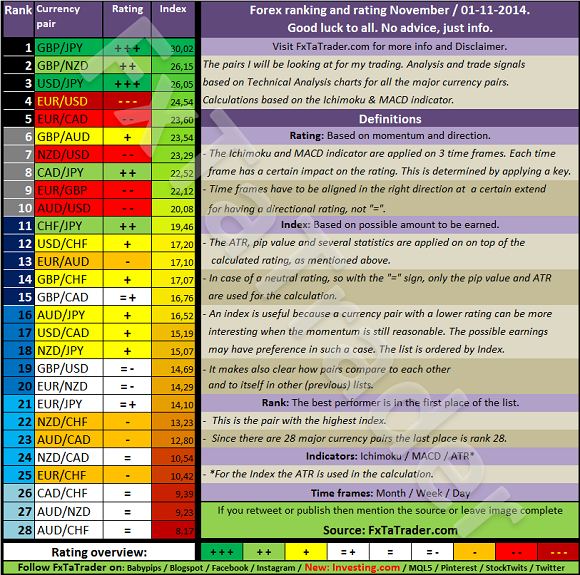
- According to the TA Charts, the "Currency score" and the "Ranking & Rating list" the Top 8 in the Forex Ranking & Rating list are the best pair to trade.
- These are the USD/JPY, GBP/JPY, EUR/USD, CAD/JPY, NZD/USD, GBP/NZD and the EUR/CAD. The pairs comply to the strategy rules for the FxTaTrader Hybrid Grid strategy.
- Last week (pending) orders were placed for the EUR/USD, NZD/CAD, GBP/CAD, CAD/JPY and the NZD/USD. Profit was made on 5 positions and losses on 2 and ending the week slightly higher.
- Every first Sunday of the month I will provide the long term strategy which has been added recently to the Hybrid Grid strategy. The strategy is under evaluation and positions have been placed on the evaluation account. The GBP/CAD is currently the interesting pair. During the month positions were taken on the USD/JPY, GBP/CAD, CAD/JPY, AUD/JPY and the EUR/GBP.
___________________________________________
Open/pending positions of last week
EUR/USD, NZD/USD and NZD/CAD
The EUR/USD and NZD/USD have been analyzed in my previous articles during the last weeks and they remain interesting for the Hybrid Grid strategy. The NZD/CAD shows similarities with the NZD/USD and because there are so many pairs to look into in this article I will not go into details on the NZD/CAD. All positions taken last week on these pairs have been closed with profit.
The pairs have improved compared to last weeks for taking short positions. It seems as a temporary top has been made. The pairs are no more oversold according to the FxTaTrader Hybrid strategy rules. According to this a pair is overbought/oversold once it is above/below the Weekly Bollinger Band. The pairs are all interesting for going short and for the FxTaTrader Hybrid Grid strategy. The monthly and weekly chart remain interesting for going short.
Because of the current pull back in the daily chart these pairs are offering possibilities.
- In the daily chart the Ichimoku is meeting all the conditions.
- The MACD is in negative territory and showing some strength building up for going short according to the histogram.
- The Parabolic SAR is going short and showing the preferred pattern of lower stop loss on opening of new long and short positions.
Ranking and rating list Week 45
EUR/USD
Rank: 3
Rating: - - -
Total outlook: Down
Rank: 5
Rating: - -
Total outlook: Down
NZD/CAD
Rank: 11
Rating: -
Total outlook: Down
___________________________________________
GBP/CAD
This pair will be analyzed briefly in this article because it has been discussed in the previous week. This pair looked interesting in the last few weeks for going long. Positions were placed starting 2 weeks ago with profit. Last week the situation changed a bit for the worse but the pair was still looking interesting enough. The 4H chart was looking weak at that time but since the pair was doing fine in the last weeks it was considered as a short temporary pull back. This was unfortunately not the case and 2 positions were closed last week with losses.
For the coming week the pair does not look that interesting anymore. The indicators are looking neutral in the Daily and 4H chart so this pair will be avoided in the coming period. It had already a low ranking in the ranking and rating list of previous week and that is this week also the case.
Ranking and rating list Week 45
Rank: 21
Rating: = +
Total outlook: Neutral
___________________________________________
EUR/GBP
This pair will be discussed briefly in this article because it has been discussed in a previous article in the period of Weeks 38&39. The situation has improved compared to last weeks for taking short positions. The momentum is growing and chances are high that this pair will resume the down trend in the coming period.
- In the daily chart the Ichimoku is meeting all the conditions.
- The MACD is in negative territory and starting to gain strength according to the histogram.
- The Parabolic SAR has improved in the last period. It is now going short and showing the preferred pattern of lower stop loss on opening of new long and short positions.
Ranking and rating list Week 45
Rank: 6
Rating: - -
Total outlook: Down
___________________________________________
CAD/JPY
This pair will be analyzed in more detail. The situation compared to last weeks has improved the pair is interesting for the Hybrid Grid strategy. At the moment the pair is overbought in the Weekly chart so it will be avoided in the coming period until it is no more overbought. According to the FxTaTrader Hybrid strategy a pair is overbought/oversold once it is above/below the Weekly Bollinger Band.
Last week (pending) orders were placed for this pair where the CAD is the average performing currency and the JPY is the weaker currency. Profit was made on 1 position.
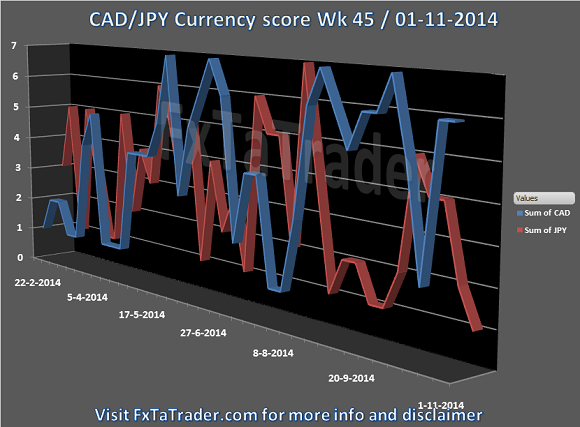
- As can be seen in the Currency Score chart in my previous article of today "Forex Currency Score Wk 45", the CAD is having a score of 5 but it is an average performing currency meaning that this score may be the highest for the time being.
- The rank in the Ranking and Rating list in the last weeks shows also that the pair is attractive for taking long positions. This list is used as additional information besides the Currency score and the Technical analysis charts.
- Besides the general information mentioned the outlook in the TA charts makes it also an attractive opportunity.
Ranking and rating list Week 45
Rank: 4
Rating: + +
Weekly Currency score: Up
Based on the currency score the pair looks interesting in the last 3 months. The CAD showed one dip in that period. The JPY had a significant pull back last weeks and retreated. It topped at a score of 5 in is now back on the lower range of the score chart. The JPY seems to become a weaker currency in the coming period. Based only on this information the pair looks interesting for going long.
Monthly chart: Up
- On the monthly(context) chart the indicators are looking reasonable for going long.
- The Ichimoku is meeting all the conditions.
- The MACD is in positive area showing consolidation but getting stronger according the histogram.
- The Parabolic SAR is long and showing the preferred pattern of higher stop loss on opening of new long and short positions.
- Since the monthly chart is used to get the context where that pair is in for the long term the indicators are looking fine because they are showing reasonable strength in the current up trend.
Weekly chart: Up
- On the weekly(decision) chart the indicators are looking strong for going long.
- The Ichimoku is meeting all the conditions.
- The MACD is in positive territory gaining strength.
- The Parabolic SAR is going long and showing the preferred pattern of higher stop loss on opening of new long and short positions.
Daily chart: Up
- On the daily(timing) chart the indicators are looking strong for going long.
- The Ichimoku is meeting all the conditions.
- The MACD has entered last week into positive territory.
- The Parabolic SAR is going long and showing the preferred pattern of higher stop loss on opening of new long and short positions. The PSAR change on 8-9-2014 during just 1 day is considered a false signal.
Total outlook: Up
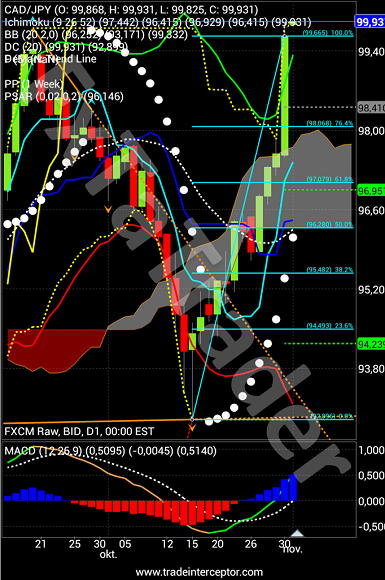
CAD/JPY Daily chart
___________________________________________
Open/pending positions evaluation account of last month
The longer term strategy does not differ much from the current strategy used on the daily chart. There are 3 important differences which are:
- The timing chart is the weekly instead of the daily and the decision chart is the monthly instead of the weekly. There is no context chart.
- There is also more emphasis on taking carry trades because positions will be held longer.
- The profit target is 1/4 ATR of the monthly chart instead of the weekly.
I will go briefly into details on all the interesting pairs for the evaluation account. For more information you can check the Evaluation account on FxTaTrader.com.
___________________________________________
GBP/CAD
Ranking and rating list November (See list below)
Rank: 15
Rating: = +
Weekly Currency score: Up
This pair have been discussed in the article of last week. Currently, the monthly chart is looking reasonable for this pair and the Weekly chart is looking weak for going long.
Last month (pending) long orders have been placed for this pair on the evaluation account. One order is currently open and another has been closed with profit.
This pair remains a very interesting pair for the longer term and for the FxTaTrader Hybrid Grid strategy. For more information on all opened positions please check my blog.
Weekly chart: Neutral
- On the weekly(timing) chart the indicators are looking weak for going long.
- The Ichimoku is not meeting all the conditions. The MA's crossed going down.
- The MACD is in positive territory but near zero.
- The Parabolic SAR is going long and showing the preferred pattern of higher stop loss on opening of new long and short positions. The 3 weeks change in PSAR in August is too short and is considered a false signal.
Total outlook: Up
The longer term strategy uses the monthly chart for decision taking and the ATR from it for the profit target. One of the reasons for using a longer term strategy is the larger profit target. However the stop loss is also larger so the strategy will work similar to the Daily strategy except that less trades will be made and they will be held longer.
After using the Weekly Ranking and Rating list for a while on the longer term strategy it seemed that the match is not really there. The list is generated using also the 4H chart and this has no relevance with the longer term strategy. A similar Ranking and Rating list has been generated where the 4H chart is not used. This ranking and rating list, together with the Currency score which will also be generated based on the same input, will be used for decision making on a longer time frame. It will be provided once a month, the list is here below:
____________________________________________
Although the explanation may seem simple and clear there is always risk involved. I added a disclaimer to my blog for this purpose. If you like to use this article then mention the source by providing the URL FxTaTrader.com or the direct link to this article. Good luck in the coming week and don't forget to check my weekly Forex "Ranking and Rating list" and the "Currency Score".


