Creating a Multi-Currency Indicator, Using a Number of Intermediate Indicator Buffers
Alexey Klenov | 10 June, 2010
Introduction
It all started when I first heard about cluster indicators from the Theoretical Basis of Building Cluster Indicators for FOREX article. This was very interesting to me at the time, and I decided to write something similar in terms of multi-market analysis. At first I implemented my own version of the indicator, codenamed MultiCurrencyIndex, in which the calculated values of the currency indexes are used to calculate the rates of classical indicators (RSI, MACD, CCI).
And now I will tell you how I transferred this indicator to a new platform, MetaTrader 5 in complement with MQL5, except that instead of calculating the CCI, I will calculate the indicator of Stochastics (Stochastic Oscillator), which is more forward-looking (in my opinion).
Let's begin with some definitions.
Dollar Index - - double value calculated by the formula, kindly provided to me by Neutron.
 ,
,
where there is USD / YYY - all direct quotations, such as USD / CHF, XXX / USD - all backward, such as EUR / USD.
Other indexes are calculated from the values of Close currency pairs, containing USD.
Main lines - two-lines of the indicator, reflecting the calculated data, related directly to the current graph. For example, on the EURUSD graph it will lines of EUR and USD currencies.
Supplementary lines - other calculated indicator lines, not related to the current graph. For example, for the same EURUSD graph, it will be the lines of GBP, CHF, JPY, CAD, AUD and NZD currencies.
Close - the value of the closing price of the bar of the current timeframe (type double) for the necessary currency pair.
Let's begin.
The problem setting
To begin with we need to set the problem.
- Synchronize the graphs of the affected currency pairs of this timeframe.
- Gain access to the Close data of seven currency pairs: EURUSD, GBPUSD, USDCHF, USDJPY, USDCAD, AUDUSD, NZDUSD, and place them into the indicator buffers, designed for auxiliary calculations.
- Based on the data obtained in item (2), calculate for the current bar the dollar index.
- Knowing the dollar Index for the current bar, calculate the remaining currency indexes.
- Perform data calculations (items 3 and 4) a required number of times for the selected length of history.
- Depending on the destination of the indicator, calculate the currency values for each of the selected indexes:
- Relative Strength Index (Relative Strength Index, RSI);
- Convergence / Divergence Moving Averages (Moving Average Convergence / Divergence, MACD);
- Stochastic Oscillator (Stochastic Oscillator);
- In the future, the list may be supplemented.
For this we will need:
31 indicator buffer:
- 0-7 inclusive - buffers to render the final lines;
- 8-14 inclusive - buffers of the major currency pairs, which contain the USD;
- 15-22 inclusive - buffers of currency indexes;
- 23-30 inclusive - buffers of intermediate data stochastics by close / close type without smoothing.
To select the destination for an indicator, we will make an enumerated type enum :
enum Indicator_Type
  {
   Use_RSI_on_indexes             = 1, // RSI of the index
   Use_MACD_on_indexes            = 2, // MACD from the index
   Use_Stochastic_Main_on_indexes = 3  // Stochastic on the index
  };
Next, using the input command, in the indicator preferences window, we will derive for the user selections from this list
input Indicator_Type ind_type=Use_RSI_on_indexes; // type of the indicator from the index
It is possible to make a more user-friendly way of displaying the names of input parameters on the "Inputs" tab. To do this we use the purpose the urgent comment, which must be placed after the description of the input parameter, in the same row. Thus, the input parameters can be compared to more easily comprehendable names for the user.
The same rules apply for the listing commands enum . That is if the mnemonic name is associated with a comment, as shown in our example, instead of the mnemonic name, the contents of this comment will be displayed . This provides additional flexibility for writing programs with clear descriptions of the input parameters.
Developers tried to provide the end user with convenient means of working with the MQL5 program, by making sure that he sees comprehendable names of parameters instead of what is written in code. More information can be found here.
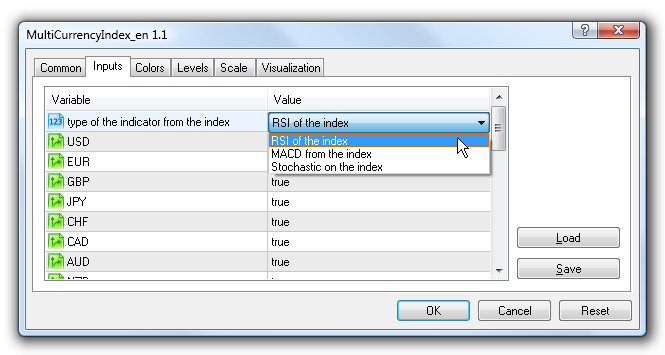
Figure 1. Selecting the type of indicator
We provide the user with a choice of necessary currencies for rendering the indicator and its color:
input bool USD=true;
input bool EUR=true;
input bool GBP=true;
input bool JPY=true;
input bool CHF=true;
input bool CAD=true;
input bool AUD=true;
input bool NZD=true;

input color Color_USD = Green;            // USD line color
input color Color_EUR = DarkBlue;         // EUR line color
input color Color_GBP = Red;             // GBP line color
input color Color_CHF = Chocolate;        // CHF line color
input color Color_JPY = Maroon;           // JPY line color
input color Color_AUD = DarkOrange;       // AUD line color
input color Color_CAD = Purple;          // CAD line color
input color Color_NZD = Teal;            // NZD line color
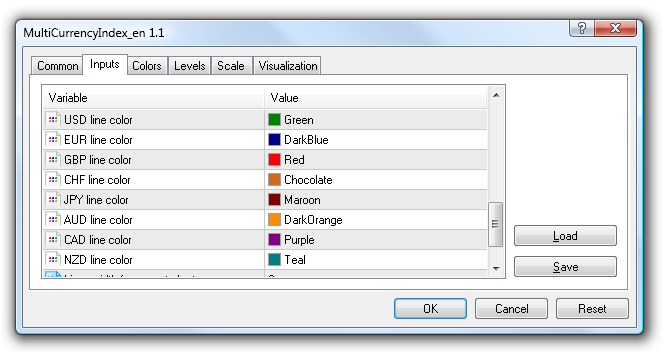
Figure 2. Selecting the color of the indicator lines
A few other configurable parameters:
input string rem000        =  ""; // depending on the type of the indicator
input string rem0000       =  ""; // requires a value :
input int rsi_period       =   9; // period RSI
input int MACD_fast        =   5; // period MACD_fast
input int MACD_slow        =  34; // period MACD_slow
input int stoch_period_k   =   8; // period Stochastic %K
input int stoch_period_sma =   5; // period of smoothing for Stochastics %K
input int shiftbars        = 500; // number of bars for calculating the indicator
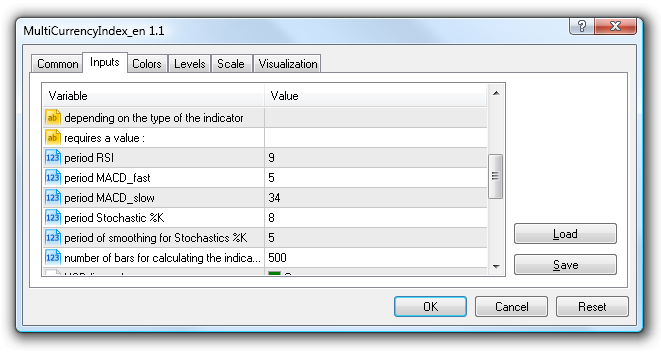
Figure 3. Indicator parameters
A limit of 500 bars for the calculation of the indicator is artificial, but it is sufficient enough to demonstrate the concept of the calculation. But we must remember, that each indicator buffer requires memory, and a display of a very large variable size (in millions of bars), may cause the computer to not have enough memory.
Indicator buffers:
double  EURUSD[], // quotes
        GBPUSD[],
        USDCHF[],
        USDJPY[],
        AUDUSD[],
        USDCAD[],
        NZDUSD[];

double    USDx[], // indexes
          EURx[],
          GBPx[],
          JPYx[],
          CHFx[],
          CADx[],
          AUDx[],
          NZDx[];

double USDplot[], // results of currency lines
       EURplot[],
       GBPplot[],
       JPYplot[],
       CHFplot[],
       CADplot[],
       AUDplot[],
       NZDplot[];

double USDStoch[], // buffers of intermediate data schotastics by the close/close type without smoothing
       EURStoch[],
       GBPStoch[],
       JPYStoch[],
       CHFStoch[],
       CADStoch[],
       AUDStoch[],
       NZDStoch[];
We will also need some global (indicator level) variables:
int              i,ii;
int           y_pos=0; // Y coordinate variable for the informatory objects
datetime   arrTime[7]; // Array with the last known time of a zero valued bar (needed for synchronization)
int        bars_tf[7]; // To check the number of available bars in different currency pairs
int        countVal=0; // Number of executable Rates
int           index=0;
datetime  tmp_time[1]; // Intermediate array for the time of the bar
And now we come to a fairly lengthy feature OnInit, using which we will distribute the indicator buffers according their purposes.
Since the initial calculations pass through the dollar index, then for USD we simply establish the possibility to disable rendering of the currency indicator buffers.
It looks like this:
if(USD)
  {
   countVal++;
   SetIndexBuffer(0,USDplot,INDICATOR_DATA);               // array for rendering
   PlotIndexSetString(0,PLOT_LABEL,"USDplot");              // name of the indicator line (when selected with a mouse)
   PlotIndexSetInteger(0,PLOT_DRAW_BEGIN,shiftbars);       // from which we begin rendering
   PlotIndexSetInteger(0,PLOT_DRAW_TYPE,DRAW_LINE);         // drawing style (line)
   PlotIndexSetInteger(0,PLOT_LINE_COLOR,Color_USD);       // color of line rendering
   if(StringFind(Symbol(),"USD",0)!=-1)
     {PlotIndexSetInteger(0,PLOT_LINE_WIDTH,wid_main);}    // if the symbol name contains USD
                                                       // then draw a line of appropriate width
   else
     {PlotIndexSetInteger(0,PLOT_LINE_STYLE,style_slave);}
   ArraySetAsSeries(USDplot,true);                       // indexation of array as a timeseries
   ArrayInitialize(USDplot,EMPTY_VALUE);                  // zero values
   f_draw("USD",Color_USD);                            // rendering in the indicator information window
  }
SetIndexBuffer(15,USDx,INDICATOR_CALCULATIONS);            // array of dollar index for calculations
                                                      // (is not displayed in the indicator as a line)
ArraySetAsSeries(USDx,true);                            // indexation of an array as a time series
ArrayInitialize(USDx,EMPTY_VALUE);                       // zero values

if(ind_type==Use_Stochastic_Main_on_indexes)
  {
   SetIndexBuffer(23,USDstoch,INDICATOR_CALCULATIONS);     // if the destination of the indicator as a Use_Stochastic_Main_on_indexes,
                                                           // then this intermediate array is needed
   ArraySetAsSeries(USDstoch,true);                        // indexation of array as a time series
   ArrayInitialize(USDstoch,EMPTY_VALUE);                  // zero values
  }
For EUR currency the function code OnInit looks like this:
if(USD)
  {
   countVal++;
   SetIndexBuffer(0,USDplot,INDICATOR_DATA);              // array for rendering
   PlotIndexSetString(0,PLOT_LABEL,"USDplot");             // name of the indicator line (when selected with a mouse)
   PlotIndexSetInteger(0,PLOT_DRAW_BEGIN,shiftbars);       // from which we begin rendering
   PlotIndexSetInteger(0,PLOT_DRAW_TYPE,DRAW_LINE);         // drawing style (line)
   PlotIndexSetInteger(0,PLOT_LINE_COLOR,Color_USD);       // color of line rendering
   if(StringFind(Symbol(),"USD",0)!=-1)
     {PlotIndexSetInteger(0,PLOT_LINE_WIDTH,wid_main);}    // if the symbol name contains USD
                                                       // then draw a line of appropriate width
   else
     {PlotIndexSetInteger(0,PLOT_LINE_STYLE,style_slave);}
   ArraySetAsSeries(USDplot,true);                       // indexation of array as a timeseries
   ArrayInitialize(USDplot,EMPTY_VALUE);                  // zero values
   f_draw("USD",Color_USD);                             // rendering in the indicator information window
  }
SetIndexBuffer(15,USDx,INDICATOR_CALCULATIONS);             // array of dollar index for calculations
                                                       // (is not displayed in the indicator as a line)
ArraySetAsSeries(USDx,true);                             // indexation of an array as a time series
ArrayInitialize(USDx,EMPTY_VALUE);                        // zero values

if(ind_type==Use_Stochastic_Main_on_indexes)
  {
   SetIndexBuffer(23,USDstoch,INDICATOR_CALCULATIONS);      // if the destination of the indicator as a Use_Stochastic_Main_on_indexes,
                                                       // then this intermediate array is needed
   ArraySetAsSeries(USDstoch,true);                      // indexation of array as a time series
   ArrayInitialize(USDstoch,EMPTY_VALUE);                 // zero values
  }

if(EUR)
  {
   countVal++;
   SetIndexBuffer(1,EURplot,INDICATOR_DATA);              // array for rendering
   PlotIndexSetString(1,PLOT_LABEL,"EURplot");             // name of the indicator line (when pointed to with a mouse)
   PlotIndexSetInteger(1,PLOT_DRAW_BEGIN,shiftbars);       // which we begin rendering from
   PlotIndexSetInteger(1,PLOT_DRAW_TYPE,DRAW_LINE);         // drawing style (lines)
   PlotIndexSetInteger(1,PLOT_LINE_COLOR,Color_EUR);       // the color of rendering lines
   if(StringFind(Symbol(),"EUR",0)!=-1)
     {PlotIndexSetInteger(1,PLOT_LINE_WIDTH,wid_main);}    // if the symbol name contains EUR
                                                       // then we draw a line of the appropriate width
   else
     {PlotIndexSetInteger(1,PLOT_LINE_STYLE,style_slave);}  // if the symbol name does NOT contain EUR,
                                                       // then we draw a line of an appropriate style (on the crosses)
   ArraySetAsSeries(EURplot,true);                       // indexation of the array as a time series
   ArrayInitialize(EURplot,EMPTY_VALUE);                  // zero values
   SetIndexBuffer(8,EURUSD,INDICATOR_CALCULATIONS);        // data of Close currency pair EURUSD
   ArraySetAsSeries(EURUSD,true);                        // indexation of the array as a time series
   ArrayInitialize(EURUSD,EMPTY_VALUE);                   // zero values
   SetIndexBuffer(16,EURx,INDICATOR_CALCULATIONS);         // array of the EURO index for calculations
                                                      // (not displayed on the indicator as a line)
   ArraySetAsSeries(EURx,true);
   ArrayInitialize(EURx,EMPTY_VALUE);
   if(ind_type==Use_Stochastic_Main_on_indexes)
     {
      SetIndexBuffer(24,EURstoch,INDICATOR_CALCULATIONS);   // if the indicator destination as a Use_Stochastic_Main_on_indexes,
                                                       // then this intermediate array is needed
      ArraySetAsSeries(EURstoch,true);                   // indexation of the array as a time series
      ArrayInitialize(EURstoch,EMPTY_VALUE);              // zero values
     }
   f_draw("EUR",Color_EUR);                            // rendering in the indicator information window
  }
By analogy with the EUR, the code will look similarly for currencies, such as GBP, JPY, CHF, CAD, AUD, and NZD, shifting the indexes of indicator buffers. The code for these currencies can be found in the attached file of the indicator.
This completes the description of the initialization of the indicator.
Next, we will need some custom user's features:
- The calculation of RSI on the user's buffer
- Calculating MACD
- Calculation of SMA on the user buffer
- Calculating Stochastic close / close without smoothing
- Rendering objects (information)
- Comment in the lower right corner of the indicator (status indicator)
- Initialization of the affected TF currency pairs
Brief description of each of these:
- The calculation of RSI on the user's buffer
Input parameters:
double f_RSI(double &buf_in[], int period,int shift),
where buf_in[] - array type double (like timeseries), period - indicator period RSI, shift - for which index bar we calculate the indicator. Returns one value of type double.
- Calculating MACD
Input parameters:
double f_MACD(double &buf_in[], int period_fast,int period_slow,int shift),
where buf_in[] - array of type double (like timeseries), period_fast - period fast МА, period_slow - period slow МА, shift - for which index bar we calculate the indicator. Returns one value of type double.
- Calculation of SMA
Input parameters:
double SimpleMA(const int position,const int period,const double &price[]),
where position - for which index bar we calculate the indicator. period - period of indicator SMA, price[] - array of time double (like time series). Returns one value of type double.
- Calculating Stochastic close / close without smoothing
Input parameters:
double f_Stoch(double &price[], int period_k, int shift),
where price[] - array of type double (like time series), period_fast - period %K indicator line, shift - for which index bar we calculate the indicator. Returns one value of type double.
- Rendering of objects
Input parameters:
int f_draw(string name, color _color)
where name - object name, _color - object color. The function is for informational purposes. Starting at the top of the right corner of the window display and further down, this function displays the names of the currencies affected. The text of the currency is the same color as the indicator line, relating to this currency.
- Comment are in the lower right corner of the indicator
Input parameters:
int f_comment(string text)
text - The text that needs to be placed in the bottom right corner of the indicator. A kind of status bar of the work of the indicator.
Finally, the concluding and one of the most important functions:
- Initialization of the affected TF currency pairs
No input parameters.
In MetaTrader 5 history is stored in the form of minute data of TF for every tool. Therefore, prior to launching the program, all of the necessary (affected) graphs are constructed, based on the same TF minute data, once the terminal is opened. Construction also takes place when the current traffic TF is being switched or during an attempt to access the graph of the TF through the MQL5 program code.
Therefore:
- During the the first time that the terminal is launched, some time is needed for the construction of (perhaps even the background, ie the user does not see them) the necessary TF of the used currency pairs.
- synchronize the zero bar for all of the affected currencies, in order to accurately display the indicator. In other words, if a there is a new incoming tick on a graph, which opens a new bar (e.g., hour bar), you will need to wait for the income of the ticks for the other currency pairs, which will, in turn, open a new bar (new hour). Only then proceed to the calculation of an indicator for the new bar.
The first part of this task is implemented using the built-in Bars function, which returns the number of bars in the history by the corresponding period to the symbol. It is sufficient enough to use the version of this function, which is shown below.
int  Bars(
   string          symbol_name,   // symbol name
   ENUM_TIMEFRAMES   timeframe    // period
   );
In the, specially announced for this array, we collect the number of available bars for all of the affected currency pairs. We check each value for the minimally necessary amount of history (the variable "number of bars for calculating the indicator" in the parameters of the indicator). If the available number of bars in the history of any instrument is less than the value of this variable, then we consider that the building was not successful, and re-examine the number of available data. Once there is more available history, for all currency pairs, than requested by the user - then we can consider that this part of the initialization has been successfully completed.
The second part of the synchronization task is implemented by using the CopyTime function.
Into a specially created for this purpose array, we copy the opening of the zero bar of each affected instrument. If all elements of this array are the same and are not equal to 0, let's consider that our zeroth bar is synchronized, and let's begin calculation. To understand how this is implemented in more details, see the code of the attached indicator.
This wraps up the description of additional functions, and we move on to implementing the OnCalculate function . Since this is a multi-currency indicator, we will need the second version of this function's request.
int OnCalculate(const int     rates_total, // size of incoming time series
                const int prev_calculated, // processing of bars on the previous request
                const datetime&    time[], // Time
                const double&      open[], // Open
                const double&      high[], // High
                const double&       low[], // Low
                const double&     close[], // Close
                const long& tick_volume[], // Tick Volume
                const long&      volume[], // Real Volume
                const int&       spread[]  // Spread
   );
Determine the amount of bars, required for the calculation:
   int limit=shiftbars;

   if(prev_calculated>0)
     {limit=1;}
   else
     {limit=shiftbars;}
Synchronizes graphs of currency pairs:
init_tf();
Next, using the CopyClose function, we copy the Close data of all of the necessary currency pairs, into the indicator buffers, registered specially for this. (For more on access to data of other TF of the current tool and / or other tool, can be found in Help )
If, for any reason, the function did not copy the data and returned an answer -1, then we display a currency pair error message into the comment, and wait for the reception of a new tick for the current instrument.
   if (EUR){copied=CopyClose("EURUSD",PERIOD_CURRENT,0,shiftbars,EURUSD); if (copied==-1){f_comment("Wait...EURUSD");return(0);}}
   if (GBP){copied=CopyClose("GBPUSD",PERIOD_CURRENT,0,shiftbars,GBPUSD); if (copied==-1){f_comment("Wait...GBPUSD");return(0);}}
   if (CHF){copied=CopyClose("USDCHF",PERIOD_CURRENT,0,shiftbars,USDCHF); if (copied==-1){f_comment("Wait...USDCHF");return(0);}}
   if (JPY){copied=CopyClose("USDJPY",PERIOD_CURRENT,0,shiftbars,USDJPY); if (copied==-1){f_comment("Wait...USDJPY");return(0);}}
   if (AUD){copied=CopyClose("AUDUSD",PERIOD_CURRENT,0,shiftbars,AUDUSD); if (copied==-1){f_comment("Wait...AUDUSD");return(0);}}
   if (CAD){copied=CopyClose("USDCAD",PERIOD_CURRENT,0,shiftbars,USDCAD); if (copied==-1){f_comment("Wait...USDCAD");return(0);}}
   if (NZD){copied=CopyClose("NZDUSD",PERIOD_CURRENT,0,shiftbars,NZDUSD); if (copied==-1){f_comment("Wait...NZDUSD");return(0);}}
Next in the cycle (from 0 to limit) we produce:
- The calculation of the dollar index;
- Calculation of indexes of other currencies on the basis of Close and the dollar index for the current bar;
for (i=limit-1;i>=0;i--)
   {
      //calculation of USD index
      USDx[i]=1.0;
      if (EUR){USDx[i]+=EURUSD[i];}
      if (GBP){USDx[i]+=GBPUSD[i];}
      if (CHF){USDx[i]+=1/USDCHF[i];}
      if (JPY){USDx[i]+=1/USDJPY[i];}
      if (CAD){USDx[i]+=1/USDCAD[i];}
      if (AUD){USDx[i]+=AUDUSD[i];}
      if (NZD){USDx[i]+=NZDUSD[i];}
      USDx[i]=1/USDx[i];
      //calculation of other currency values
      if (EUR){EURx[i]=EURUSD[i]*USDx[i];}
      if (GBP){GBPx[i]=GBPUSD[i]*USDx[i];}
      if (CHF){CHFx[i]=USDx[i]/USDCHF[i];}
      if (JPY){JPYx[i]=USDx[i]/USDJPY[i];}
      if (CAD){CADx[i]=USDx[i]/USDCAD[i];}
      if (AUD){AUDx[i]=AUDUSD[i]*USDx[i];}
      if (NZD){NZDx[i]=NZDUSD[i]*USDx[i];}
   }
The data is placed into the appropriate indicator buffers. Check which type of indicator was selected by the user during initialization, and on this basis, produce relevant calculations.
If there the desire to look at the RSI of the indexes was demonstrated, then execute the code below:
if (ind_type==Use_RSI_on_indexes)
   {
      if (limit>1){ii=limit - rsi_period - 1;}
      else{ii=limit - 1;}
      for(i=ii;i>=0;i--)
         {
            if (USD){USDplot[i]=f_RSI(USDx,rsi_period,i);}
            if (EUR){EURplot[i]=f_RSI(EURx,rsi_period,i);}
            if (GBP){GBPplot[i]=f_RSI(GBPx,rsi_period,i);}
            if (CHF){CHFplot[i]=f_RSI(CHFx,rsi_period,i);}
            if (JPY){JPYplot[i]=f_RSI(JPYx,rsi_period,i);}
            if (CAD){CADplot[i]=f_RSI(CADx,rsi_period,i);}
            if (AUD){AUDplot[i]=f_RSI(AUDx,rsi_period,i);}
            if (NZD){NZDplot[i]=f_RSI(NZDx,rsi_period,i);}
         }
   }
If we wanted to see the MACD by the indexes, then we go here (but so far it is only implemented on the basis of SimpleMA, and will be implemented on the basis of EMA later):
if (ind_type==Use_MACD_on_indexes)
   {
      if (limit>1){ii=limit - MACD_slow - 1;}
      else{ii=limit - 1;}
      for(i=ii;i>=0;i--)
         {
           if (USD){USDplot[i]=f_MACD(USDx,MACD_fast,MACD_slow,i);}
           if (EUR){EURplot[i]=f_MACD(EURx,MACD_fast,MACD_slow,i);}
           if (GBP){GBPplot[i]=f_MACD(GBPx,MACD_fast,MACD_slow,i);}
           if (CHF){CHFplot[i]=f_MACD(CHFx,MACD_fast,MACD_slow,i);}
           if (JPY){JPYplot[i]=f_MACD(JPYx,MACD_fast,MACD_slow,i);}
           if (CAD){CADplot[i]=f_MACD(CADx,MACD_fast,MACD_slow,i);}
           if (AUD){AUDplot[i]=f_MACD(AUDx,MACD_fast,MACD_slow,i);}
           if (NZD){NZDplot[i]=f_MACD(NZDx,MACD_fast,MACD_slow,i);}
         }
   }
If Stochastis, you must first calculate the line% K, and then smooth it out by the SimpleMA method. The final smoothed line must be displayed on the graph.
if (ind_type==Use_Stochastic_Main_on_indexes)
   {
      if (limit>1){ii=limit - stoch_period_k - 1;}
      else{ii=limit - 1;}
      for(i=ii;i>=0;i--)
         {
           if (USD){USDstoch[i]=f_Stoch(USDx,rsi_period,i);}
           if (EUR){EURstoch[i]=f_stoch(EURx,stoch_period_k,i);}
           if (GBP){GBPstoch[i]=f_stoch(GBPx,stoch_period_k,i);}
           if (CHF){CHFstoch[i]=f_stoch(CHFx,stoch_period_k,i);}
           if (JPY){JPYstoch[i]=f_stoch(JPYx,stoch_period_k,i);}
           if (CAD){CADstoch[i]=f_stoch(CADx,stoch_period_k,i);}
           if (AUD){AUDstoch[i]=f_stoch(AUDx,stoch_period_k,i);}
           if (NZD){NZDstoch[i]=f_stoch(NZDx,stoch_period_k,i);}
         }
      if (limit>1){ii=limit - stoch_period_sma - 1;}
      else{ii=limit - 1;}
      for(i=ii;i>=0;i--)
         {
            if (USD){USDplot[i]=SimpleMA(i,stoch_period_sma,USDstoch);}
            if (EUR){EURplot[i]=SimpleMA(i,stoch_period_sma,EURstoch);}
            if (GBP){GBPplot[i]=SimpleMA(i,stoch_period_sma,GBPstoch);}
            if (CHF){CHFplot[i]=SimpleMA(i,stoch_period_sma,CHFstoch);}
            if (JPY){JPYplot[i]=SimpleMA(i,stoch_period_sma,JPYstoch);}
            if (CAD){CADplot[i]=SimpleMA(i,stoch_period_sma,CADstoch);}
            if (AUD){AUDplot[i]=SimpleMA(i,stoch_period_sma,AUDstoch);}
            if (NZD){NZDplot[i]=SimpleMA(i,stoch_period_sma,NZDstoch);}
          }
   }
This completes the calculation of indicators. Figures 4-6 demonstrate a few pictures of the different types of indicators.
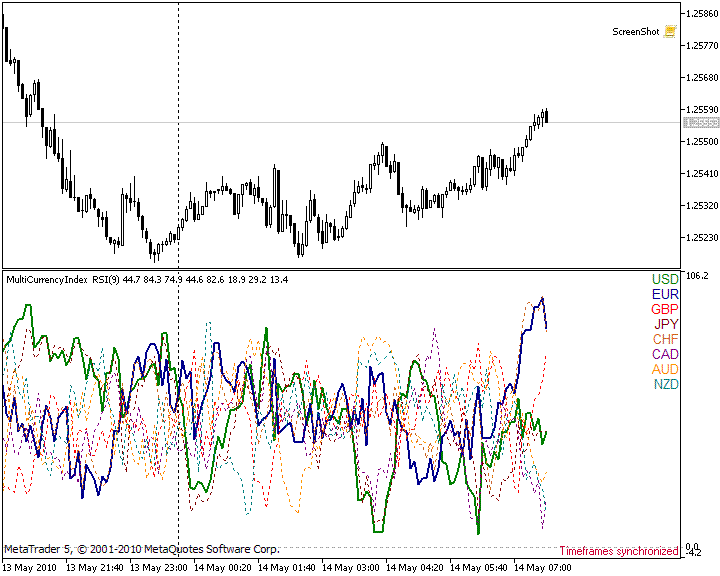
Figure 4. RSI by the indexes
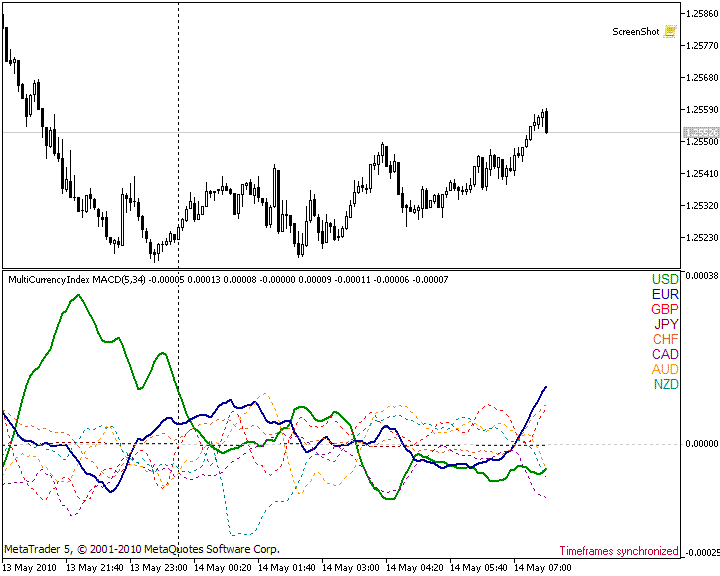
Figure 5. MACD by the indexes of currencies
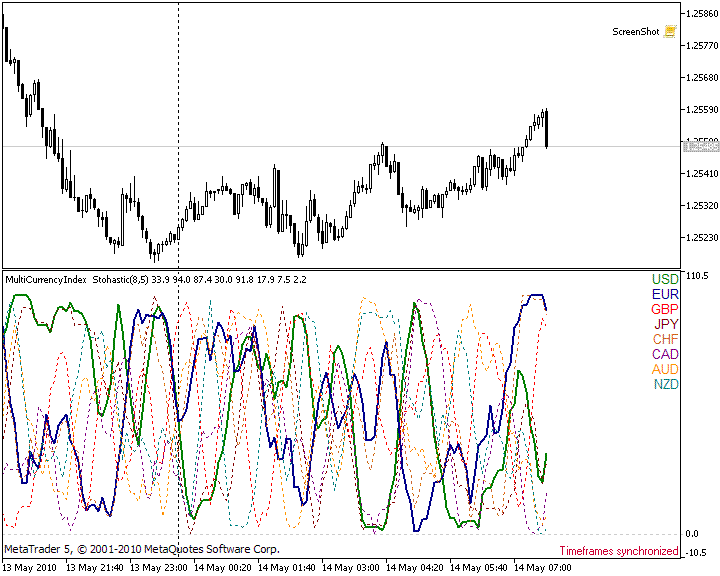
Figure 6. Stochastis by the indexes of currencies
Conclusion
While implementing the MultiCurrencyIndex indicator, I used an unlimited number of indicator buffers in MQL5, which greatly simplified the code. This article is an example of such an approach. For reliable data of an indicator, I demonstrated an algorithm of synchronization of different instruments relative to the zero bar. I also demonstrated one of the possible algorithms of accessing data from other instruments, relative to the symbol, to which the indicator is attached.
Since the purpose of the article was to demonstrate the possibility of working with a huge amount of indicator buffers; the above function of calculating the indicators by the users' data arrays, was not the optimum way to avoid overburdening the reader. But it was sufficient enough to perform the necessary calculations.
There are many pros and cons of the cluster analysis of the Forex market. Trading systems, based on this approach, are freely available, and there are discussions of it on various forums, including on MQL4.Community. Therefore, the principles of trading by this indicator are not considered in this article.