
An Insight Into Accumulation/Distribution And Where It Can Get You

Introduction
It is known that the Accumulation/Distribution A/D Indicator has one interesting feature - a breakout of the trend line plotted in this indicator chart suggests, with a certain degree of probability, a forthcoming breakout of the trend line in the price chart:
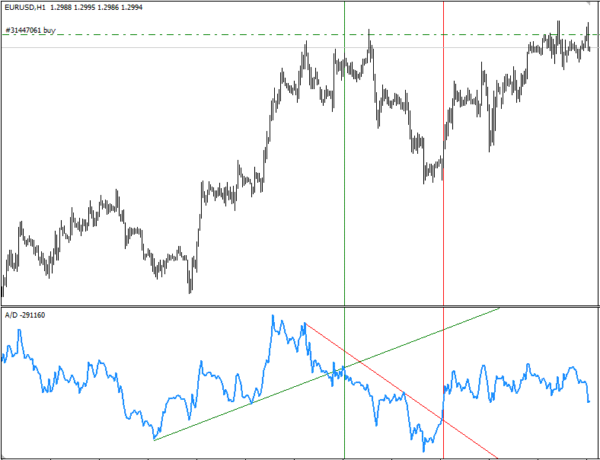
I was determined to check this fact, and having plotted all trend lines in the A/D chart, I quickly realized that manual approach to tackling this issue would be inexpedient. That is why I developed a function that automatically plots trend lines in the A/D chart and sets signal indicators in the price chart. I would now like to show a step-wise procedure of how it all can be implemented using MQL4 to be further used in your trading robots.
This article will be useful and interesting for those who are new to programming in MQL4. Having this in view, I have tried to present the information in an easy to grasp manner and use the simplest code structures.
1. Setting a Task
Let us first define the task to be set.
The function will in the general case find a crossing point between the trend line plotted in the A/D chart and the line of the indicator itself, return the value indicating the direction of the crossover - downward or upward - and set signal indicators (up/down arrows depending on the crossover direction) in the price chart for illustrative purposes.
Let us now break this general task into more specific objectives:
- The function should be able to work on any symbol and any time frame;
- Since this function is designed to be a part of an EA, the A/D indicator does not need to be in the main chart.
- Signal indicators do not necessarily have to be displayed in the price chart either - all calculations are performed within the function and are only displayed to visually monitor the function operation.
- The crossovers can occur in different directions: downward crossover of the uptrend, upward crossover of the uptrend, upward crossover of the downtrend, downward crossover of the downtrend. The function will identify every such crossover.
This is it as far as the function capabilities are concerned. Let us now consider the ways of accomplishing our task.
2. Filling Arrays with A/D Indicator Data
When called, the function will receive some values: at the moment - the array for storing A/D indicator data, the number of bars of history for identification of A/D chart extrema, the instrument (symbol) name and time frame.
Trend lines are drawn based on the A/D chart extrema identified whereby an uptrend line connects lower extrema and a downtrend line connects upper extrema.
An uptrend line requires two lower extrema, where the extremum with the lowest value shall be to the left of the extremum located in immediate proximity to the current (zero) bar. The same is true for a downtrend: the extremum with the highest value shall be to the left of the extremum being next to the current bar.
If no extrema satisfying these requirements can be identified, trend lines are not drawn on this tick. We are going to call these trend lines "global":

Further, we add two more lines to the drawn "global" trend lines which require the use of two far right extrema, whereby
- an uptrend needs a lower extremum with a smaller value (to the left of the lower extremum with a greater value); and
- a downtrend needs an upper extremum with a greater value (to the left of the upper extremum with a smaller value).
If no extrema satisfying these requirements can be identified, trend lines are not drawn on this tick.
These trend lines are going to be referred to as "local":
As a result, what we can see is as follows:
In the majority of cases, we will not need "local" extrema due to peculiarities of identifying "global" extrema and drawing trend lines by connecting them. The option to search for and draw "local" extrema will be allowed to be disabled.
The function operation will require the availability of EA's global variables, particularly an array for storing A/D data. Let us write it to the EA's global variables:
double TempIND[]; // Array for storing A/D indicator data
Now, the indicator data should be read in order to fill the array:
int SignalCrossIND(double &TempIND[], int nBars, string sy, int tf)
{
   if (sy=="" || sy=="0") sy = Symbol();
   ArrayResize(TempIND,nBars);       // Resize the array according to the size passed to the function
   for (int j=0; j<=nBars-1; j++)
      {
         TempIND[j]=iAD(sy,tf,j);    // Write indicator data in the loop into the array
      }
}
Let us analyze what we have just written here:
int SignalCrossIND(double &TempIND[], int nBars, string sy, int tf)
Definition of the function as such where the parameters to be passed are TempIND[] - the name of the array containing indicator values (passed by reference), nBars - the number of bars of history from which the values are obtained, sy - instrument (symbol) name and time frame tf.
Generally, the function call can be as follows:
SignalCrossIND(TempIND, 30, NULL, 5);
where TempIND is the array name, 30 is the number of bars, NULL is the current symbol of the chart, and 5 is М5 time frame.
The next line is:
if (sy=="" || sy=="0") sy = Symbol();
it checks the name of the trading instrument passed to the function and if its value is NULL or 0, the current chart symbol is used.
We then resize the array according to the value passed to the function in the nBars variable and fill it with indicator values from zero bar to the nBars-1 bar in the loop. Since the array cells are numbered starting from zero, the first number will be 0 instead of 1 and the last number will consequently be 29 instead of 30. We therefore use nBars-1 (in our example, 30-1=29).
At this stage, our function fills the array with A/D indicator data. We now need to identify extrema in the A/D chart data array.
3. Identification of Extrema in A/D Indicator Data Arrays
Let us start. Operation of the function requires not only global variables but also variables to be used by the function itself.
At this stage, we need to declare two more (internal) arrays that will be used for writing upper extrema (peaks) and lower extrema (troughs), two arrays in which we are going to save the time of extrema and some variables to be used for the needs of the function:
// ------------------------------------------------------------------------------------------
// -------------------------------- Function variables --------------------------------------
// ------------------------------------------------------------------------------------------

   double   PeakUP[], PeakDN[];     // Declare peak/trough arrays
   datetime TimeDN[], TimeUP[];     // Arrays for storing the time of extrema
   int      i, k;                   // Internal variables of the function
and finally proceed to their identification:
//------------------------------------------------------------------
// Filling arrays with data on peaks and troughs
//------------------------------------------------------------------
    k=0;                                   // Initialize the trough array index
    for (i=2; i<=nBars-1; i++)             // Run through the array of values
       {
          if (TempIND[i]<TempIND[i-1] &&
              TempIND[i+1]>=TempIND[i])    // Trough identified
             {
                ArrayResize(PeakDN, k+1);  // Resize the trough array according to the number of troughs identified
                ArrayResize(TimeDN, k+1);  // Resize the trough time array according to the number of troughs
                PeakDN[k]=TempIND[i];      // Write the trough value into the trough array...
                TimeDN[k]=iTime(sy,tf,i);  // ...and the time array
                k++;                       // Increase the trough array index
             }
        }
// -----------------------------------------------------------------------------------------------------------
    k=0;                                   // Initialize the peak array index
    for (i=2; i<=nBars-1; i++)             // Run through the array of values
       {
          if (TempIND[i]>TempIND[i-1] &&
              TempIND[i+1]<=TempIND[i])    // Peak identified
             {
                ArrayResize(PeakUP, k+1);  // Resize the peak array according to the number of peaks identified
                ArrayResize(TimeUP, k+1);  // Resize the peak time array according to the number of peaks
                PeakUP[k]=TempIND[i];      // Write its value into the peak array...
                TimeUP[k]=iTime(sy,tf,i);  // ...and the time array
                k++;                       // Increase the peak array index
             }
       }
The above needs clarification on what is done and how it is done. First, we arrange two separate loops - for identification of upper and lower extrema, respectively.
Let us go over the operation of the first loop for the identification of troughs (lower extrema):
We start with the initialization of the variable k to zero - it will point to the first (zero) element of the array where the identified troughs will be written into. We then loop through the array of the A/D indicator values filled earlier, the starting point being not the first (zero) index of the array but the third one corresponding to bar 2 (i=2;).
Why is that? Since an extremum is a break point in the indicator chart, where the value on the first bar is greater than that on the second bar and the value on the second bar is less than that on the third one (trough), we set the index on the third element of the array (keeping in mind that the elements are numbered starting from zero), assuming it may be an extremum. Zero bar is not used in calculations to eliminate false positives.
Then, we start our first iteration and check
- whether the value on bar 2 TempIND[i] is less than that on bar 1 TempIND[i-1] and
- whether the value on bar 3 TempIND[i+1] is greater than that on bar 2 TempIND[i].
If this condition is true (the extremum is identified), we first increase the trough array and trough time array sizes by 1:
ArrayResize(PeakDN, k+1);     // Resize the trough array according to the number of troughs identified
ArrayResize(TimeDN, k+1);     // Resize the trough time array according to the number of troughs
and then write the data from the array of indicator values into these arrays and increase the trough array index by one:
PeakDN[k]=TempIND[i];         // Write the trough value into the trough array...
TimeDN[k]=iTime(sy,tf,i);     // ...and the time array
k++;                          // Increase the trough array index
Now the trough and trough time arrays, PeakDN and TimeDN respectively, contain the required data on the identified extremum and the trough array index points at the next cell of this array. The next loop iteration follows the same pattern when identifying the next extremum and its data is written into the new cell of the trough array that the trough array index (k) points at.
Peaks (upper extrema) are identified in a quite similar manner, except that the first, second and third bars are compared in the opposite way: the less-than sign and greater-than sign should be interchanged. At this stage, our function can read the A/D indicator data, fill the array using this data and identify extrema in it, as well as save values and locations of extrema into the four designated arrays.
This is when we can start displaying trend lines in the indicator chart plotting them based on the extrema identified.
Let us first display "global" trend lines in the indicator chart. In order to plot them by connecting the chart extrema, we should start with the identification of two extrema - the extremum with the smallest value in the entire trough array and the extremum we will refer to as main. The main extremum will be located in immediate proximity to the beginning of the trough array and be set strictly equal to 2. Thus, the first two extrema being closest of all to the current bar in the indicator chart will not be taken into account (to leave a certain freedom to the price movement without having to react to a slightest change occurring in it).
Now that the main extremum is identified, we need to find the extremum with the smallest value in the array located to the left of the main extremum. This extremum will be the lowest in the indicator chart serving as the starting point for the final identification of the second extremum.
Drawing of a trend line in such a way that it connects the lowest extremum and the main extremum will most likely lead to the situation where the trend line is crossed by the extrema higher than the lowest extremum identified. And it means that the beginning of the trend line should in this situation be moved to the extremum crossing the trend line. The Figures below are a clear demonstration of such a case:

It can be seen that the line originating at the lowest extremum is crossed by higher extrema as it extends towards the main extremum. It is therefore necessary in this situation to carefully analyze the array of extrema and identify the one that, when defined as the originating point of the trend line, will not lead to the situation where the trend line is crossed by any subsequent extrema.
The extremum following the lowest extremum is not suitable either - should the trend line originate at that point, it would still be crossed by higher extrema:
I have left out further "attempts" here and proceeded directly to the "right" extremum identified:
It is now time to start coding it all up. We use lower extrema to draw the uptrend line and upper extrema to draw the downtrend line.
Let us review an example of plotting an uptrend line through lower extrema.
4. Identification of Two Extrema in the Array of A/D indicator Extrema for Plotting a Trend Line
Identification of two necessary extrema will require the availability of internal variables of the function for storing and passing values of the lower and upper minimum and main extrema, for storing and passing the time of the lower and upper minimum and main extrema and a variable for indexing the arrays.
We are going to add them to our function variables (not to go back to this matter later on, we will add all necessary function variables right away to start using them immediately):
// ------------------------------------------------------------------------------------------
// -------------------------------- Function variables ----------------------------
// ------------------------------------------------------------------------------------------

   double   PeakUP[], PeakDN[],        // Declare peak/trough arrays
            yUP, yDN, yGUP, yGDN,      // Coordinates of the crossing point between the trend line and indicator UP and DN on the 1st bar
            yUP2, yDN2, yGUP2, yGDN2,  // Coordinates of the crossing point between the trend line and indicator UP and DN on the 2nd bar
            CheckCross,
            PreLastVarDN,LastVarDN,    // Values of the last and last but one lower extrema
            PreLastVarUP,LastVarUP,    // Values of the last and last but one upper extrema
            PivotPeakDN,PivotPeakUP,
            LowestPeakDN,HighestPeakDN,// Values of the lower minimum and maximum
            LowestPeakUP,HighestPeakUP,// Values of the upper minimum and maximum

   datetime TimeDN[], TimeUP[],        // Arrays for storing bars of extrema
            PreLastTimeDN, LastTimeDN, // Time of the last and last but one lower extrema
            PreLastTimeUP, LastTimeUP, // Time of the last and last but one upper extrema
            PivotBarDN, PivotTimeDN,   // Bar and time of the lower main extremum
            PivotBarUP, PivotTimeUP,   // Bar and time of the upper main extremum
            LowestBarDN, LowestTimeDN, // Bar and time of the lower minimum
            HighestBarUP, HighestTimeUP;// Bar and time of the upper maximum
   int      i, kup, kdn, pbar=2,
            m, l, t, asize, Index,      // "Internal" variables
            WinID=WindowFind("A/D");    // AD window number
   bool     CrossDN = false,            // Flag indicating the downward crossover of the local trend
            CrossUP = false,            // Flag indicating the upward crossover of the local trend
            CrossGDN = false,           // Flag indicating the downward crossover of the global trend
            CrossGUP = false;           // Flag indicating the upward crossover of the global trend

   double   pt=MarketInfo(Symbol(),MODE_POINT); // Point size in the quote currency
and add a code for identification of lower extrema:
//====================================================================================================
// --------------------------- Identification of lower DN minimum and maximum -------------
//====================================================================================================

  PivotTimeDN = TimeDN[pbar];                     // Time of the main extremum
  PivotBarDN  = iBarShift(sy,tf,TimeDN[pbar]);    // Bar of the main extremum
  PivotPeakDN = PeakDN[pbar];                     // Value of the main extremum
  LowestPeakDN  = ArrayMin(PeakDN);               // Get the lower minimum value
  Index = ArraySearchDouble(PeakDN, LowestPeakDN);// Get the index of the lower minimum in the array
  LowestBarDN =iBarShift(sy,tf,TimeDN[Index]);    // Get the bar of the lower minimum
  LowestTimeDN = TimeDN[Index];                   // Get the time of the lower minimum
The bar of the main extremum is strictly set in the variable pbar and the time of the main extremum is therefore obtained from the time array by the index contained in this variable.
PivotTimeDN = TimeDN[pbar]; // Time of the main extremum
The bar of the main extremum is obtained from the time array and its value is calculated using the standard function int iBarShift( string symbol, int timeframe, datetime time, bool exact=false).
It will be briefly described a bit later when considering the identification of the minimum in the array of extrema.
The value of the main extremum is obtained from the array of values specifying the required value using the variable pbar (which contains the main extremum index):
PivotPeakDN = PeakDN[pbar]; // Value of the main extremum
To identify the lower minimum, you can use the standard function int ArrayMinimum(double array[], int count=WHOLE_ARRAY, int start=0) which is what we are going to use, only arranging the calculation to be done by calling a user-defined function. This function will return the extremum identification result.
Not to reinvent the wheel, we are going to identify the minimum element in the array using a ready made function kindly offered for public use by Igor Kim in his forum thread. It perfectly suits our needs and can send a relevant error report to the log, should the array passed to it be empty (this comes in handy when debugging):
//+----------------------------------------------------------------------------+
//|  Author    : Igor B. Kim aka KimIV,  http://www.kimiv.ru                   |
//+----------------------------------------------------------------------------+
//|  Version   : 17.05.2008                                                    |
//|  Description : Returns the value of the minimum element in the array.      |
//+----------------------------------------------------------------------------+
//|  Parameters:                                                               |
//|    x - array of values of numerical series                                 |
//+----------------------------------------------------------------------------+
double ArrayMin(double& x[]) {
  if (ArraySize(x)>0) return(x[ArrayMinimum(x)]);
  else {
    Print("ArrayMin(): Array empty!");
    return(0);
  }
}
As you can see, there is absolutely nothing difficult about it - it is the same standard function ArrayMinimum() that checks for required data in the array passed. A similar function obtained from the same source is going to be used to get the index of the minimum element in the array by its value:
//+----------------------------------------------------------------------------+
//|  Author    : Igor B. Kim aka KimIV,  http://www.kimiv.ru                   |
//+----------------------------------------------------------------------------+
//|  Version   : 01.09.2005                                                    |
//|  Description : Finds an array element by its value                         |
//|             and returns the index of the found element or -1.              |
//+----------------------------------------------------------------------------+
//|  Parameters:                                                               |
//|    m - array of elements                                                   |
//|    e - value of the element                                                |
//+----------------------------------------------------------------------------+
int ArraySearchDouble(double& m[], double e) {
  for (int i=0; i<ArraySize(m); i++) {
    if (m[i]==e) return(i);
  }
  return(-1);
}
Here, we loop through the entire array searching for the value passed to the function. If the value passed to the function matches the value of an array element, the function returns the value of the variable i which upon matching is equal to the index of the sought value in the array. If the sought value is not found, the function will return -1 which can be used to error check your program.
We now need to find the bar in the chart that corresponds to the extremum identified. For this purpose, we are going to use the data from the earlier filled time array TimeDN[] and the index (Index) of the required extremum we have just obtained:
// Get the bar of the lower minimum
LowestBarDN =iBarShift(sy,tf,TimeDN[Index]);
To do this, we use the standard function int iBarShift( string symbol, int timeframe, datetime time, bool exact=false)
Finding the bar by time. The function returns the shift of the bar that has the time specified. If there is no bar for the specified time (a "gap" in the history), the function, depending on the exact parameter, returns -1 or the shift of the nearest bar.
Here, the first parameter to be passed to the function is the current symbol of the chart stored in the variable sy, the second parameter to be passed is the current time frame stored in the variable tf and time datetime time passed to iBarShift() that is stored in the time array TimeDN[] and indexed by the value of the variable Index obtained during the previous step.
We leave the default value of bool exact because passing true when the bar is missing (a "gap" in the history) will cause the function to return -1 which will afterwards be used in further calculations and lead to an error. The default value false , should the bar be missing from the history, will cause the function to return the value of the nearest bar, which is not good either, yet is better than the value being absolutely wrong.
Now, to get a complete picture of the whole thing and further calculations, we are also going to save the time of the bar found as described above. This is very simple: we have saved time in the TimeDN[] array. And we are going to obtain it from this array using the same index:
// Get the time of the lower minimum
LowestTimeDN = TimeDN[Index];
So we have identified the main extremum and the minimum. We now need to see whether the trend line connecting the two identified chart points is going to be crossed by other extrema located between the two identified extrema (as already mentioned above):
Such crossovers will be identified using a virtual line plotted through the minimum towards the main extremum. We will loop through the array of extrema, from the minimum towards the main extremum and once the crossing point between the extremum and the line is found, it will be treated as the originating point of the line and we will again loop through the array, this time starting from the extremum we have just identified to the main extremum.
The extrema crossing the line are going to be run through until there is no more of them left. This will mean that we have identified the required extremum, and that the extrema following it on the way to the main extremum do not cross the trend line.
if (LowestBarDN>PivotBarDN)                           // If the minimum is to the right of the first extremum ...
                                                      // ... (being in 0 cell of the trough time array)
for (m=Index-1; m>pbar; m--)                          // Loop from the extremum following the minimum to the first extremum
  {
// --------- Draw a virtual trend line and check it for crossovers with other extrema -----
  CheckCross=EquationDirect(iBarShift(sy,tf,TimeDN[m+1]),
                            PeakDN[m+1],                      // First coordinate of the line
                            PivotBarDN, PivotPeakDN,          // Second coordinate of the line
                            iBarShift(sy,tf,TimeDN[m],false));// Crossing point associated with the next extremum
      if (TempIND[iBarShift(sy,tf,TimeDN[m])]<CheckCross)     // If the extremum lies below the line
         {
            if (PeakDN[m]<PeakDN[pbar])                       // if this extremum is lower than the main extremum
               {
                  LowestBarDN =iBarShift(sy,tf,TimeDN[m]);    // Then this is the one we need to start from...
                  LowestPeakDN  = PeakDN[m];                  // New coordinates of the next extremum
                  LowestTimeDN = TimeDN[m];
               }
         }
   }
Here, we have arranged a loop from the extremum following the minimum to the first extremum in the array of extrema. This is done because the minimum will be the originating point when drawing the line while the check for crossovers will start from the next extremum.
The virtual line will be drawn using the straight line equation function that calculates the value of Y for X at the point of crossing with the straight line:
double EquationDirect(double x1, double y1, double x2, double y2, double x) {
if (x2==x1) return(y1);
return((y2-y1)/(x2-x1)*(x-x1)+y1);
x1 and y1 are the coordinates of the first point; x2 and y2 are the coordinates of the second point; x is the value for which y is calculated. This function is taken from I. Kim's forum thread.
So:
CheckCross=EquationDirect(iBarShift(sy,tf,TimeDN[m+1]), PeakDN[m+1], // First coordinate of the line
                          PivotBarDN, PivotPeakDN,                   // Second coordinate of the line
                          iBarShift(sy,tf,TimeDN[m],false));         // Crossing point associated with the next extremum
Insert the bar of the minimum as the x-coordinate of the first point and the value of the minimum as the y-coordinate of the first point into the function parameters to be passed. The bar and the value of the main extremum will be used as the second coordinate of the virtual line point.
The last value to be passed to the function is the bar number which is passed in the loop to the function for calculation of the value of the y-coordinate and comparison of the resulting value with the value of the extremum located at the given point.
if (TempIND[iBarShift(sy,tf,TimeDN[m])]<CheckCross)  // If the extremum lies below the line
   {
    if (PeakDN[m]<PeakDN[pbar])                      // if this extremum is lower than the main extremum
       {
         LowestBarDN  =iBarShift(sy,tf,TimeDN[m]);   // Then this is the one we need to start from...
         LowestPeakDN = PeakDN[m];                   // New coordinates of the next extremum
         LowestTimeDN = TimeDN[m];
        }
   }
Thus, if the value returned by the function is greater than the value of the extremum located at the given point, then the extremum crosses the virtual line and the line should originate from this extremum. Save the new coordinate values and proceed to the next loop iteration to identify a crossover with the next extremum.
Once we identify the extremum following which the line is not crossed by any further extrema, it is going to be used for drawing the trend line. All we need to know is whether the value of this extremum is less than that of the main extremum and whether it lies to the left of the main extremum meaning that the line drawn from it towards the main extremum will be going up in the right direction.
if (LowestBarDN>PivotBarDN && LowestPeakDN<PivotPeakDN)// If the minimum is to the left of and below the main extremum
And it means that we now have all the data required to plot an uptrend line in the A/D chart.
5. Plotting Trend Lines in the A/D Chart
To identify the presence of the A/D indicator window in the main chart window, we introduce another variable WinID that is going to store the A/D chart subwindow number:
WinID=WindowFind("A/D"); // AD window number
Here, the standard function WindowFind("name"); returns the number of the chart subwindow that contains the indicator with the specified name name, if it is found; otherwise -1 is returned. There is basically no need to draw the trend line in the A/D chart as it is not required in calculations; however we are going to draw it for clarity and to make sure that everything is correct:
if (WinID>0)
   {
    if (ObjectFind("Trend_GLine_DN")<0)
    ObjectCreate("Trend_GLine_DN",OBJ_TREND,WinID,LowestTimeDN,LowestPeakDN,PivotTimeDN,PivotPeakDN);
    ObjectSet("Trend_GLine_DN",OBJPROP_COLOR,Lime);
    ObjectSet("Trend_GLine_DN",OBJPROP_TIME1,LowestTimeDN);
    ObjectSet("Trend_GLine_DN",OBJPROP_PRICE1,LowestPeakDN);
    ObjectSet("Trend_GLine_DN",OBJPROP_TIME2,PivotTimeDN);
    ObjectSet("Trend_GLine_DN",OBJPROP_PRICE2,PivotPeakDN);
   }
We here first check if the A/D indicator window is present in the main window. If it is not there, there is nowhere to draw:
if (WinID>0)
It is simple: if the indicator is not attached to the chart window, the WindowFind() function will return -1. The main chart window, i.e. the chart itself, always has zero value and we therefore check if the value is "greater than zero". Since apart from the A/D chart, there may be other indicators in the chart window, we cannot know for certain what number will be assigned to the A/D we need and consequently do not check the number itself but rather if the value is greater than zero.
Further... If the window identifier (WinID) is greater than zero, the A/D chart is considered to be present in the window and we can proceed to drawing. We then check whether a trend line has already been drawn in the chart using the trend line name:
if (ObjectFind("Trend_GLine_DN")<0)
and if it is not there yet (the ObjectFind() function returned -1, otherwise the A/D window index is returned), we can start drawing. For this purpose, we use the function:
ObjectCreate("Trend_GLine_DN",OBJ_TREND,WinID,LowestTimeDN,LowestPeakDN,PivotTimeDN,PivotPeakDN);
bool ObjectCreate(string name, int type, int window, datetime time1, double price1, datetime time2=0, double price2=0, datetime time3=0, double price3=0) creates an object with a specified name, type and initial coordinates in a specified chart subwindow. The number of coordinates associated with the object can be 1 to 3 depending on the type. Upon successful completion of the object the function returns TRUE, otherwise FALSE.
Let us review it in detail:
- string name takes the value of the name of the object required to be created - in our case, "Trend_GLine_DN" (global trend line connecting lower extrema); the next parameter passed to the function is int type, i.e. the object type - in our case, it reasonably is OBJ_TREND...
- int window is the A/D indicator window identifier stored in the variable WinIND...
Further parameters passed to the function are coordinates of the two points that are used to plot the trend line:
- datetime time1 is the first time coordinate of the minimum saved in the variable LowestTDN,
- double price1 is the first value coordinate of the minimum saved in the variable LowestPeakDN,
- datetime time2 is the second time coordinate of the minimum saved in the variable HighestTDN,
- double price2 is the second value coordinate of the minimum saved in the variable HighestPeakDN.
Other parameters of the ObjectCreate() function are not used in plotting the trend line.
So, at this stage, the trend line object has been created. Now we need to modify some of its parameters. Particularly, the line color and line coordinates. The line color will be constant, while the coordinates will need to be modified every time data on new extrema changes and use the new coordinates to plot the trend line:
ObjectSet("Trend_GLine_DN",OBJPROP_COLOR,Lime);
bool ObjectSet( string name, int prop_id, double value) changes the value of the specified objects property. If successful, the function returns TRUE, otherwise FALSE. This code line sets the color of the uptrend line by assigning to it the standard color constant Lime used in the set of Web colors.
The parameters passed to the function are:
- string name - the name of the object whose properties need to be modified - in our case, "Trend_GLine_DN",
- int prop_id - identifier of the object properties that need to be modified. We first change the color, therefore the identifier will be OBJPROP_COLOR,
- double value - new value of the specified object property. This is where the color constant Lime is passed to.
I believe, the modification of other object properties should not pose any difficulty - it is similar to the above example involving the change in the object color:
ObjectSet("Trend_GLine_DN",OBJPROP_TIME1,LowestTimeDN);
ObjectSet("Trend_GLine_DN",OBJPROP_PRICE1,LowestPeakDN);
ObjectSet("Trend_GLine_DN",OBJPROP_TIME2,PivotTimeDN);
ObjectSet("Trend_GLine_DN",OBJPROP_PRICE2,PivotPeakDN);
At first, we change the first time coordinate of the extremum (OBJPROP_TIME1), followed by changing the first value coordinate (OBJPROP_PRICE1), then we change the second time coordinate of the extremum (OBJPROP_TIME2) and the second value coordinate (OBJPROP_PRICE1). All coordinate values are written to the variables LowestTimeDN, LowestPeakDN, PivotTimeDN and PivotPeakDN.
Our trend line is drawn in the A/D indicator chart (subject to the presence of the indicator window itself). Now, we need to identify the crossing point between the line in the A/D chart and the trend line plotted using the indicator chart extrema. Thinking over this task, I came to the conclusion that it will be easier (for me) to calculate the crossing point using the straight line equation.
6. Identification of the Crossing Point Between the A/D Chart Line and the Trend Line Plotted Through the Indicator Chart Extrema
Having two points through which the trend line is plotted, we use the straight line equation to calculate an imaginary line that will be projected on the first bar of the A/D indicator line. (we work with the first bar to reduce the number of false positives).
The point calculated using the straight line equation and projected on the first bar of the indicator will be the point where we are going to check for crossovers. Further, we only need to mark these calculated points in the A/D chart and check the sole fact of them being crossed by the indicator line either downward or upward.
There is another point to consider. Since we are going to identify the crossing point as such, as opposed to being higher/lower, our calculations will also require the second bar of the A/D indicator chart. If the indicator line is higher than the crossing point on the first bar and lower than or equal to the crossing point on the second bar, we have an upward crossover. Thus, we will calculate two lines based on the extrema. The first line will be projected on the first bar of the indicator and the second line will be projected on the second bar.
Imaginary crossing points will be marked for better visualization of our calculation results.
So let us start...
7. Identification and Marking of Possible Crossing Points
We are going to need additional variables for storing the calculated values of possible crossing points.
We have already added them to the list of function variables:
// ------------------------------------------------------------------------------------------
// -------------------------------- Function variables ----------------------------
// ------------------------------------------------------------------------------------------
   double   PeakUP[], PeakDN[],           // Declare peak/trough arrays
            yUP, yDN, yGUP, yGDN,         // Coordinates of the crossing point between the trend line and indicator UP and DN on the 1st bar
            yUP2, yDN2, yGUP2, yGDN2,     // Coordinates of the crossing point between the trend lines and indicator UP and DN on the 2nd bar
            LowestPeakDN,HighestPeakDN,   // Values of the lower minimum and maximum
            LowestPeakUP,HighestPeakUP;   // Values of the upper minimum and maximum
   datetime TimeDN[], TimeUP[],           // Arrays for storing bars of extrema
            LowestTimeDN, HighestTimeDN,  // Bar of the lower minimum and maximum
            LowestTimeUP, HighestTimeUP,  // Bar of the upper minimum and maximum
            LowestTDN, HighestTDN,        // Time of the lower minimum and maximum
            LowestTUP, HighestTUP;        // Time of the upper minimum and maximum
   int      i, k, Index,                  // "Internal" variables
            WinID=WindowFind("A/D");      // AD window number
Getting ahead of the story, I would like to mention that instead of 4, we have added 8 variables as another 4 variables will be required for the calculation of "local" trend lines and crossing points. We are now going to use yGUP, yGDN, yGUP2 and yGDN2 to store the points of crossing with
- the "global" uptrend line yGUP on the first bar; yGUP2 - on the second bar and
- the "global" downtrend line yGDN on the first bar; yGDN2 - on the second bar.
Let us once again use the straight line equation function kindly furnished by Igor Kim:
//+----------------------------------------------------------------------------+
//|  Author    : Igor B. Kim aka KimIV,  http://www.kimiv.ru                   |
//+----------------------------------------------------------------------------+
//|  Version   : 12.10.2007                                                    |
//|  Description : Straight line equation. Calculates the Y value for X        |
//|                at the point of crossing with the straight line.            |
//+----------------------------------------------------------------------------+
//|  Parameters:                                                               |
//|    x1,y1 - coordinates of the first point,                                 |
//|    x2,y2 - coordinates of the second point,                                |
//|    x     - value for which Y needs to be calculated                        |
//+----------------------------------------------------------------------------+
double EquationDirect(double x1, double y1, double x2, double y2, double x)
{
  if (x2==x1) return(y1);
  return((y2-y1)/(x2-x1)*(x-x1)+y1);
}
5 parameters will be passed to the function as starting points for calculation: two for the coordinates of the two chart extrema and the last parameter being the bar on which the crossing point should be found:
yGDN =EquationDirect(LowestBarDN,LowestPeakDN,PivotBarDN,PivotPeakDN,iBarShift(sy,tf,Time[1],false));
yGDN2=EquationDirect(LowestBarDN,LowestPeakDN,PivotBarDN,PivotPeakDN,iBarShift(sy,tf,Time[2],false));
Here the coordinates of the minimum are used as the coordinates of the first point: x1 = LowestTimeDN, y1 = LowestPeakDN, while the coordinates of the main extremum are used as the coordinates of the second point: x2 = PivotBarDN, y2 = PivotPeakDN.
The shift of the required bar is passed as the value for which the equation is calculated: iBarShift(sy, tf, Time[1], false), where sy is the symbolic name of the currency instrument, tf is the time frame, Time[1] is the time series array containing the opening time of every bar in the current chart. The datetime data type represents time in seconds elapsed from 00:00 January 1st, 1970.
The remaining parameters of this function have been discussed earlier. I would like to point out that if our function is going to be used in a multi-currency EA, then instead of Time[1] , we should use the standard function iTime() (which is what we are going to implement in the final variant of the function) which explicitly receives values of the currency instrument and the time frame used, whereas Time[] only works with the current chart.
We have the crossing levels calculated and stored in the variables. For clarity they can now be marked in the A/D indicator chart:
if (WinID>0)
     {
         if (ObjectFind("PointGDN"+Time[1])<0)
         ObjectCreate("PointGDN"+Time[1],OBJ_ARROW,WinID,Time[1],yGDN);
         ObjectSet("PointGDN"+Time[1],OBJPROP_ARROWCODE,4);
         ObjectSet("PointGDN"+Time[1],OBJPROP_COLOR,Lime);
         ObjectSet("PointGDN"+Time[1],OBJPROP_TIME1,Time[1]);
         ObjectSet("PointGDN"+Time[1],OBJPROP_PRICE1,yGDN);
     }
This is similar to what we have had when plotting the trend line. Let us have a look at some slight differences.
The first difference is in the object name:
ObjectCreate("PointGDN"+Time[1],OBJ_ARROW,WinID,Time[1],yGDN);
Since we are not going to create a single object but rather a whole set of objects on every new bar, the names of all objects should be unique. For this purpose, the time of the bar on which the object is created will be added to the object name:
"PointGDN"+Time[1]
The second difference is in the identifier of the graphics object type. While for plotting the trend line we used OBJ_TREND, we will now use OBJ_ARROW that allows to draw arrows (symbols). Further, WinID is the number of the subwindow where the object will be drawn - in our case this is the A/D window number, and there are two coordinates - the time coordinate Time[1] being the time of the first bar and the price coordinate yGDN being the crossing point between the trend line and the first bar as calculated.
The object properties are set as follows:
ObjectSet("PointGDN"+Time[1],OBJPROP_ARROWCODE,4);
The identifier of the object properties OBJPROP_ARROWCODE sets the object code and can be one of the wingdings symbols or one of the predefined arrow codes. In order to set the object precisely at the calculated level, there are special arrow codes that point at the exact price and time. We are going to use the hyphen (–), its code being 4. The remaining lines set the object color and its constantly changing coordinates on each bar.
ObjectSet("PointGDN"+Time[1],OBJPROP_COLOR,Lime);
ObjectSet("PointGDN"+Time[1],OBJPROP_TIME1,Time[1]);
ObjectSet("PointGDN"+Time[1],OBJPROP_PRICE1,yGDN);
Now we have the possible crossing points between the indicator line and the "global" uptrend line plotted based on the extrema drawn. It is these points that are going to be required to check for crossovers. If a crossover is found, the signal indicator - the down arrow - will be set in the main chart which is, by the way, what we are going to do right now.
8. Checking for Crossovers of the A/D Line and the Calculated Crossing Points and Setting Signal Indicators
To identify whether there is a crossover of the A/D indicator line and the crossing points, we simply compare their values as being greater than/less than and if the value of the indicator line on a given bar is less than the crossing point value, while the indicator value on the previous bar is greater than the crossing point value, then what we deal with is a downward crossover:
if (NormalizeDouble(TempIND[1],8) < NormalizeDouble(yGDN,8) &&
     NormalizeDouble(TempIND[2],8) >= NormalizeDouble(yGDN2,8))
    {
        CrossGDN = true;           // Set the flag indicating the downward crossover
        CrossGUP = false;          // Remove the flag indicating the upward crossover

        if (ObjectFind("ArrowGDN"+Time[1])<0)
        ObjectCreate("ArrowGDN"+Time[1],OBJ_ARROW, 0 ,Time[1], iHigh(sy,tf,1)+5*pt);
        ObjectSet("ArrowGDN"+Time[1],OBJPROP_ARROWCODE,242);
        ObjectSet("ArrowGDN"+Time[1],OBJPROP_COLOR,OrangeRed);
        ObjectSet("ArrowGDN"+Time[1],OBJPROP_WIDTH,1);
        ObjectSet("ArrowGDN"+Time[1],OBJPROP_TIME1,Time[1]);
        ObjectSet("ArrowGDN"+Time[1],OBJPROP_PRICE1,iHigh(sy,tf,1)+5*pt);
    }
In order to be compared, the double type data values need to be normalized to the required accuracy by the standard function double NormalizeDouble(double value, int digits). Floating point numbers are to be rounded to the required accuracy.
The calculated StopLoss and TakeProfit values, as well as opening prices of pending orders should be normalized to the accuracy as set in the predefined variable Digits:
if (NormalizeDouble(TempIND[1],8) < NormalizeDouble(yGDN,8) &&
    NormalizeDouble(TempIND[2],8) >= NormalizeDouble(yGDN2,8))
which is exactly what we did when comparing the indicator line values with the calculated crossing point values. If this condition is met, the variables of the bool type CrossGDN and CrossGUP are assigned the values true and false , respectively.
The next block of the code sets the down arrow in the terminal's main chart window:
if (ObjectFind("ArrowGDN"+Time[1])<0)
  ObjectCreate("ArrowGDN"+Time[1],OBJ_ARROW, 0 ,Time[1], iHigh(sy,tf,1)+5*pt);
  ObjectSet("ArrowGDN"+Time[1],OBJPROP_ARROWCODE,242);
  ObjectSet("ArrowGDN"+Time[1],OBJPROP_COLOR,OrangeRed);
  ObjectSet("ArrowGDN"+Time[1],OBJPROP_WIDTH,1);
  ObjectSet("ArrowGDN"+Time[1],OBJPROP_TIME1,Time[1]);
  ObjectSet("ArrowGDN"+Time[1],OBJPROP_PRICE1,iHigh(sy,tf,1)+5*pt);
I believe this code block does not require a special clarification as we have already discussed how marks and lines can be set in windows of the terminal. The only difference not considered earlier is the specification of the main chart window of the terminal. The number of this window is always 0, therefore by setting 0 as the window identifier in the below line
ObjectCreate("ArrowGDN"+Time[1],OBJ_ARROW, 0 ,Time[1], iHigh(sy,tf,1)+5*pt);
we allow to set arrows in the main window of the terminal.
A few more things to pay attention to: the maximum price value of the bar above which the arrow will be set serves as the y-coordinate of the down arrow (its code is 242) and the indent is set to 5 points:
iHigh(sy,tf,1)+5*pt
double iHigh( string symbol, int timeframe, int shift) returns the maximum price value specified by the parameter shift of the bar from the relevant chart (symbol, timeframe).
The value of pt is obtained from the line immediately following the declaration of the function variables:
double pt=MarketInfo(Symbol(),MODE_POINT);
This is a standard function double MarketInfo( string symbol, int type). It returns various information on financial instruments listed in the "Market Watch" window. Function query identifier MODE_POINT returns the point size in the quote currency. For the current instrument, it is stored in the predefined variable Point. The line:
ObjectSet("ArrowGDN"+Time[1],OBJPROP_WIDTH,1);
sets the size of the displayed arrow = 1.
9. Checking for Crossover of the Uptrend Line in the Direction of the Price Movement of the Currency Pair
A downward crossover of an uptrend line may signal that the price movement of the currency pair may change shortly, whereas an upward crossover of the same uptrend line may suggest that the price will continue to move in the same direction. Therefore, to be on the safe side, we are also going to check for this type of crossover, while at the same allowing for the check to be disabled, if necessary.
For this purpose, we change the first line of the function by adding to it another two parameters to be passed to the function:
int SignalCrossIND(double &TempIND[], int nBars, string sy, int tf, bool local=false, bool add=false)
We have here added two variables of the bool type: local and add. The variable local is in charge of the calculation required to display "local" trend lines, while the variable add serves to check for an upward crossover of the uptrend line and a downward crossover of the downtrend line. By default, these variables are set to false which means if they are omitted when calling the function, the function will not calculate, nor display the local trend lines, nor will it check for those crossovers.
if (add)
    {
       if (NormalizeDouble(TempIND[1],8) > NormalizeDouble(yGDN,8) &&
           NormalizeDouble(TempIND[2],8) <= NormalizeDouble(yGDN2,8))
           {
              CrossGUP = true;
              CrossGDN = false;
              if (ObjectFind("ArrowGUP"+Time[1])<0)
              ObjectCreate("ArrowGUP"+Time[1],OBJ_ARROW, 0 ,Time[1], iLow(sy,tf,1));
              ObjectSet("ArrowGUP"+Time[1],OBJPROP_ARROWCODE,241);
              ObjectSet("ArrowGUP"+Time[1],OBJPROP_COLOR,Lime);
              ObjectSet("ArrowGUP"+Time[1],OBJPROP_WIDTH,0);
              ObjectSet("ArrowGUP"+Time[1],OBJPROP_TIME1,Time[1]);
              ObjectSet("ArrowGUP"+Time[1],OBJPROP_PRICE1,iLow(sy,tf,1));
           }
    }
Everything is familiar in this code block and there is basically no need to look into it. What we need to pinpoint is the check of the variable add:
if (add)
is absolutely identical to this:
if (add==true)
and checks whether this variable is set to "true". If it is, all lines enclosed in matching parenthesis {} following the given line get executed. There are only two lines left to consider:
ObjectSet("ArrowGUP"+Time[1],OBJPROP_ARROWCODE,241);
Here, the last parameter passed to the function is the up arrow code - 241, and
ObjectSet("ArrowGUP"+Time[1],OBJPROP_WIDTH,0);
where the last value passed to the function denotes the size of the arrow drawn. In our case, we are going to display a small arrow of size 0.
The code we have at the moment is functionally complete: it reads the A/D indicator data and uses it to fill the array, identifies indicator chart extrema, plots the uptrend line in the chart, checks for crossovers of this line and the A/D indicator line and, should such crossover be identified, it places up or down arrows (depending on the crossover direction) in the main chart of the currency instrument located in the window of the terminal.
Below is the code for a similar check but this time for the downtrend line. It is given for your independent analysis:
//====================================================================================================
// -------------------- Identification of upper UP minimum and maximum --------------------
//====================================================================================================
    PivotTimeUP = TimeUP[pbar];                           // Time of the main extremum
    PivotBarUP  = iBarShift(sy,tf,TimeUP[pbar]);          // Bar of the main extremum
    PivotPeakUP = PeakUP[pbar];                           // Value of the main extremum

    HighestPeakUP = ArrayMax(PeakUP);                     // Get the upper maximum value
    Index = ArraySearchDouble(PeakUP, HighestPeakUP);     // Get the index of the upper maximum in the array
    HighestBarUP =iBarShift(sy,tf,TimeUP[Index]);         // Get the bar of the upper maximum
    HighestTimeUP = TimeUP[Index];                        // Get the time of the upper maximum

    if (HighestBarUP>PivotBarUP)                          // If the maximum is to the left of the first extremum ...
                                                          // ... (being in 0 cell of the peak time array)
   for (m=Index-1; m>pbar; m--)                           // Loop from the extremum following the maximum to the first extremum
      {
// --------- Draw a virtual trend line and check it for crossovers with other extrema ----------
      CheckCross=EquationDirect(iBarShift(sy,tf,TimeUP[m+1]),
                                PeakUP[m+1],                      // First coordinate of the line
                                PivotBarUP, PivotPeakUP,          // Second coordinate of the line
                                iBarShift(sy,tf,TimeUP[m],false));// Crossing point associated with the next extremum
      if (TempIND[iBarShift(sy,tf,TimeUP[m])]>CheckCross)         // If the extremum lies above the line
         {
            if (PeakUP[m]>PeakUP[pbar])                           // if this extremum is higher the main extremum
               {
                  HighestBarUP =iBarShift(sy,tf,TimeUP[m]);       // Then this is the one we need to start from...
                  HighestPeakUP = PeakUP[m];                      // New coordinates of the next extremum
                  HighestTimeUP = TimeUP[m];
               }
         }
   }

   if (HighestBarUP>PivotBarUP && HighestPeakUP>PivotPeakUP)      // If the maximum is to the left of the main extremum
      {
// ---------------- Draw a downtrend line (UP - extrema) ---------------------
          if (WinID>0)
             {
                if (ObjectFind("Trend_Line_GUP")<0)
                ObjectCreate("Trend_Line_GUP",OBJ_TREND,WinID,HighestTimeUP,HighestPeakUP,PivotTimeUP,PivotPeakUP);
                ObjectSet("Trend_Line_GUP",OBJPROP_COLOR,OrangeRed);
                ObjectSet("Trend_Line_GUP",OBJPROP_TIME1,HighestTimeUP);
                ObjectSet("Trend_Line_GUP",OBJPROP_PRICE1,HighestPeakUP);
                ObjectSet("Trend_Line_GUP",OBJPROP_TIME2,PivotTimeUP);
                ObjectSet("Trend_Line_GUP",OBJPROP_PRICE2,PivotPeakUP);
             }
//---------------- Calculation of levels of the downtrend (UP - extrema) ------------------
    yGUP =EquationDirect(HighestBarUP, HighestPeakUP, PivotBarUP, PivotPeakUP, iBarShift(sy,tf,Time[1],false));
    yGUP2=EquationDirect(HighestBarUP, HighestPeakUP, PivotBarUP, PivotPeakUP, iBarShift(sy,tf,Time[2],false));

//---------------- Draw levels of the downtrend (UP - extrema) ------------------
         if (WinID>0)
            {
               if (ObjectFind("PointGUP"+Time[1])<0)
               ObjectCreate("PointGUP"+Time[1],OBJ_ARROW,WinID,Time[1],yGUP);
               ObjectSet("PointGUP"+Time[1],OBJPROP_ARROWCODE,4);
               ObjectSet("PointGUP"+Time[1],OBJPROP_COLOR,OrangeRed);
               ObjectSet("PointGUP"+Time[1],OBJPROP_TIME1,Time[1]);
               ObjectSet("PointGUP"+Time[1],OBJPROP_PRICE1,yGUP);
            }

// --------------- Check for an upward crossover of the downtrend -----------------
         if (NormalizeDouble(TempIND[1],8) > NormalizeDouble(yGUP,8) &&
             NormalizeDouble(TempIND[2],8) <= NormalizeDouble(yGUP2,8))
               {
                  CrossGUP = true;                 // Set the flag indicating the upward crossover
                  CrossGDN = false;                // Remove the flag indicating the downward crossover

                  if (ObjectFind("ArrowGUP"+Time[1])<0)
                  ObjectCreate("ArrowGUP"+Time[1],OBJ_ARROW, 0 ,Time[1], iLow(sy,tf,1));
                  ObjectSet("ArrowGUP"+Time[1],OBJPROP_ARROWCODE,241);
                  ObjectSet("ArrowGUP"+Time[1],OBJPROP_COLOR,Lime);
                  ObjectSet("ArrowGUP"+Time[1],OBJPROP_WIDTH,1);
                  ObjectSet("ArrowGUP"+Time[1],OBJPROP_TIME1,Time[1]);
                  ObjectSet("ArrowGUP"+Time[1],OBJPROP_PRICE1,iLow(sy,tf,1));
               }

// --------------- Check for a downward crossover of the downtrend -----------------

         if (add)
            {
               if (NormalizeDouble(TempIND[1],8) < NormalizeDouble(yGUP,8) &&
                   NormalizeDouble(TempIND[2],8) >= NormalizeDouble(yGUP2,8))
                  {
                     CrossGDN = true;
                     CrossGUP = false;

                     if (ObjectFind("ArrowGDN"+Time[1])<0)
                     ObjectCreate("ArrowGDN"+Time[1],OBJ_ARROW, 0 ,Time[1], iHigh(sy,tf,1)+15*pt);
                     ObjectSet("ArrowGDN"+Time[1],OBJPROP_ARROWCODE,242);
                     ObjectSet("ArrowGDN"+Time[1],OBJPROP_COLOR,OrangeRed);
                     ObjectSet("ArrowGDN"+Time[1],OBJPROP_WIDTH,0);
                     ObjectSet("ArrowGDN"+Time[1],OBJPROP_TIME1,Time[1]);
                     ObjectSet("ArrowGDN"+Time[1],OBJPROP_PRICE1,iHigh(sy,tf,1)+15*pt);
                  }
            }
      }
10. Identification of "Local" Extrema in the A/D Chart, Plotting of Trend Lines Through the Extrema Identified and Checking for Crossovers
So, there is only one little thing left: to arrange the same as above for "local" extrema.
The only thing in which they differ from "global" extrema is the method of their identification. They will be identified using two rightmost extrema and if (for an uptrend) the first extremum appears to be higher than the second one located to the left of the first extremum, we will assume that a local trend line can be drawn. For a downtrend, the second extremum identified should be higher than and to the left of the first extremum.
Since the code is going to be absolutely identical to the one already reviewed above (it will in fact be almost identical, except for some points), I will provide it in full for a local uptrend line:
// --------------------------- Identification of two (local) outermost lower DN extrema ------------
   if (local)
      {
         asize=ArraySize(PeakDN);
         for (l=asize-1; l>=1; l--)
            {
               if (PeakDN[l]<PeakDN[l-1])
                  {
                     LastTimeDN     =TimeDN[l-1];
                     LastVarDN      =PeakDN[l-1];
                     PreLastTimeDN  =TimeDN[l];
                     PreLastVarDN   =PeakDN[l];
                  }
            }
// --------------- Draw a local uptrend line (DN - extrema) -----------------
         if (WinID>0)
            {
               if (ObjectFind("Trend_Line_DN")<0)
               ObjectCreate("Trend_Line_DN",OBJ_TREND,WinID,TimeDN[1],PeakDN[1],TimeDN[0],PeakDN[0]);
               ObjectSet("Trend_Line_DN",OBJPROP_COLOR,MediumSeaGreen);
               ObjectSet("Trend_Line_DN",OBJPROP_TIME1,PreLastTimeDN);
               ObjectSet("Trend_Line_DN",OBJPROP_PRICE1,PreLastVarDN);
               ObjectSet("Trend_Line_DN",OBJPROP_TIME2,LastTimeDN);
               ObjectSet("Trend_Line_DN",OBJPROP_PRICE2,LastVarDN);
            }
//---------------- Calculation of levels of the local uptrend (DN - extrema) ----------------
  yDN =EquationDirect(iBarShift(sy,tf,PreLastTimeDN,false), PreLastVarDN,
                      iBarShift(sy,tf,LastTimeDN,false), LastVarDN, iBarShift(sy,tf,Time[1],false));
  yDN2=EquationDirect(iBarShift(sy,tf,PreLastTimeDN,false), PreLastVarDN,
                      iBarShift(sy,tf,LastTimeDN,false), LastVarDN, iBarShift(sy,tf,Time[2],false));

//---------------- Draw levels of the local uptrend (DN - extrema) ----------------
         if (WinID>0)
            {
               if (ObjectFind("PointDN"+Time[1])<0)
               ObjectCreate("PointDN"+Time[1],OBJ_ARROW,WinID,Time[1],yDN);
               ObjectSet("PointDN"+Time[1],OBJPROP_ARROWCODE,4);
               ObjectSet("PointDN"+Time[1],OBJPROP_COLOR,MediumSeaGreen);
               ObjectSet("PointDN"+Time[1],OBJPROP_TIME1,Time[1]);
               ObjectSet("PointDN"+Time[1],OBJPROP_PRICE1,yDN);
            }
// --------------- Check for a downward crossover of the local uptrend -----------------
         if (NormalizeDouble(TempIND[1],8) < NormalizeDouble(yDN,8) &&
             NormalizeDouble(TempIND[2],8) >= NormalizeDouble(yDN2,8))
               {
                  CrossDN = true;
                  CrossUP = false;
                  if (Arrow)                 // If the use of signal indicators is allowed
                     {
                        if (ObjectFind("ArrowDN"+Time[1])<0)
                        ObjectCreate("ArrowDN"+Time[1],OBJ_ARROW, 0 ,Time[1], iHigh(sy,tf,1)+15*pt);
                        ObjectSet("ArrowDN"+Time[1],OBJPROP_ARROWCODE,242);
                        ObjectSet("ArrowDN"+Time[1],OBJPROP_COLOR,Chocolate);
                        ObjectSet("ArrowDN"+Time[1],OBJPROP_WIDTH,1);
                        ObjectSet("ArrowDN"+Time[1],OBJPROP_TIME1,Time[1]);
                        ObjectSet("ArrowDN"+Time[1],OBJPROP_PRICE1,iHigh(sy,tf,1)+15*pt);
                     }
               }
// --------------- Check for an upward crossover of the local uptrend -----------------
         if (add)
            {
               if (NormalizeDouble(TempIND[1],8) > NormalizeDouble(yDN,8) &&
                   NormalizeDouble(TempIND[2],8) <= NormalizeDouble(yDN2,8))
                  {
                     CrossUP = true;
                     CrossDN = false;
                     if (Arrow)                 // If the use of signal indicators is allowed
                        {
                           if (ObjectFind("ArrowUP"+Time[1])<0)
                           ObjectCreate("ArrowUP"+Time[1],OBJ_ARROW, 0 ,Time[1], iLow(sy,tf,1));
                           ObjectSet("ArrowUP"+Time[1],OBJPROP_ARROWCODE,241);
                           ObjectSet("ArrowUP"+Time[1],OBJPROP_COLOR,MediumSeaGreen);
                           ObjectSet("ArrowUP"+Time[1],OBJPROP_WIDTH,0);
                           ObjectSet("ArrowUP"+Time[1],OBJPROP_TIME1,Time[1]);
                           ObjectSet("ArrowUP"+Time[1],OBJPROP_PRICE1,iLow(sy,tf,1));
                        }
                  }
            }
      }
The only difference here is in the identification of extrema through which the trend line is plotted:
if (local)
This line checks if the drawing of the trend line and calculation of crossovers of the A/D chart are allowed.
We then run through the loop looking for two outermost extrema:
asize=ArraySize(PeakDN);
  for (l=asize-1; l>=1; l--)
      {
       if (PeakDN[l]<PeakDN[l-1])
          {
            LastTimeDN     =TimeDN[l-1];
            LastVarDN      =PeakDN[l-1];
            PreLastTimeDN  =TimeDN[l];
            PreLastVarDN   =PeakDN[l];
          }
      }
and write their values to the variables LastTimeDN, LastVarDN, PreLastTimeDN and PreLastVarDN, where
- LastTimeDN contains the time of the last extremum,
- LastVarDN contains the value of the last extremum,
- PreLastTimeDN contains the time of the last but one extremum and
- PreLastVarDN contains the value of the last but one extremum.
After that, the code is virtually identical to that already considered above, except for the variables used for drawing the trend lines and identification of crossovers with them. And finally, we should arrange for the function values to be returned by this finishing touch,
which in the general case can be as follows:
if (CrossGUP || CrossUP) return(1);
   else
   if (CrossGDN || CrossDN) return(-1);
   else return(0);
Where there is a downward crossover of the uptrend line, the function returns -1; where there is a downward crossover of the downtrend line, the function returns 1; in all other cases the function returns 0 - it is simple as that.
It is certainly better to check all crossovers of the uptrend and downtrend lines, either upward or downward, assign them "weights", depending on the combination of crossovers, and return the required values to the calling function for further processing of the signal.
In conclusion of the function description, I am going to give its complete code, including some minor changes made (featuring the check of whether it is allowed to set signal indicators when a crossover of the trend line and the A/D chart line is identified, as well as the use of the standard function iTime() instead of Time to ensure the generality of the function).
The code provided below will hopefully be comprehensible, after the extensive consideration given above:
//жжжжжжжжжжжжжжжжжжжжжжжжжжжжжжжжжжжжжжжжжжжжжжжжжжжжжжжжжжжжжжжжжжжжжжжжжжжжжжжжжжжжжжжжжж // Identification of a crossover of the trend line and the A/D chart line and setting of the signal indicators //жжжжжжжжжжжжжжжжжжжжжжжжжжжжжжжжжжжжжжжжжжжжжжжжжжжжжжжжжжжжжжжжжжжжжжжжжжжжжжжжжжжжжжжжжж // TempIND[] - (declared on the global level) array for storing A/D indicator data // nBars - number of bars for identification of extrema // sy - working symbol: "" or NULL - current symbol of the chart // tf - working time frame: 0 - current, // local - whether to calculate based on local trends: by default - false // add - whether to react to the crossover of the trend in the direction of the trend: by default - false // Arrow - whether to set signal indicators in the currency instrument chart // when a crossover of the trend line and the A/D chart line is identified: by default - true //========================================================================================== int SignalCrossIND(double &TempIND[], int nBars, string sy, int tf, bool local=false, bool add=false, bool Arrow=true) { if (sy=="" || sy=="0") sy = Symbol(); ArrayResize(TempIND,nBars); // Resize the array according to the size passed to the function for (int j=0; j<=nBars-1; j++) { TempIND[j]=iAD(sy,tf,j); // Write the indicator data in the loop into the array } // ========================================================================================== // ------------------------------------ Function variables ---------------------------------+ // ========================================================================================== double PeakUP[], PeakDN[], // Declare peak/trough arrays yUP, yDN, yGUP, yGDN, // Coordinates of the crossing point between the trend line and indicator UP and DN on the 1st bar yUP2, yDN2, yGUP2, yGDN2, // Coordinates of the crossing point between the trend line and indicator UP and DN on the 2nd bar CheckCross, PreLastVarDN,LastVarDN, // Values of the last and last but one lower extrema PreLastVarUP,LastVarUP, // Values of the last and last but one upper extrema PivotPeakDN,PivotPeakUP, LowestPeakDN,HighestPeakDN, // Values of the lower minimum and maximum LowestPeakUP,HighestPeakUP, // Values of the upper minimum and maximum datetime TimeDN[], TimeUP[], // Arrays for storing bars of extrema PreLastTimeDN, LastTimeDN, // Time of the last and last but one lower extrema PreLastTimeUP, LastTimeUP, // Time of the last and last but one upper extrema PivotBarDN, PivotTimeDN, // Bar and time of the lower main extremum PivotBarUP, PivotTimeUP, // Bar and time of the upper main extremum LowestBarDN, LowestTimeDN, // Bar and time of the lower minimum HighestBarUP, HighestTimeUP; // Bar and time of the upper maximum int i, kup, kdn, pbar=2, m, l, t, asize, Index, // "Internal" variables WinID=WindowFind("A/D"); // AD window number bool CrossDN = false, // Flag indicating the downward crossover of the local trend CrossUP = false, // Flag indicating the upward crossover of the local trend CrossGDN = false, // Flag indicating the downward crossover of the global trend CrossGUP = false; // Flag indicating the upward crossover of the global trend double pt=MarketInfo(Symbol(),MODE_POINT); // Point size in the quote currency // ========================================================================================== // ------------------ Filling arrays with data on peaks and troughs ----------------------+ // ========================================================================================== kdn=0; // Initialize the trough array index for (i=2; i<=nBars-1; i++) // Run through the array of values from the 2nd bar deep into history { if (TempIND[i]<TempIND[i-1] && TempIND[i+1]>=TempIND[i]) // Trough identified WAS THERE >= { ArrayResize(PeakDN, kdn+1); // Resize the trough array according to the number of troughs identified ArrayResize(TimeDN, kdn+1); // Resize the trough time array according to the number of troughs PeakDN[kdn]=TempIND[i]; // Write the trough value into the trough array... TimeDN[kdn]=iTime(sy,tf,i); // ...and the time array kdn++; // Increase the trough array index } } // ----------------------------------------------------------------------------------------------------------- kup=0; // Initialize the peak array index for (i=2; i<=nBars-1; i++) // Run through the array of values from the 2nd bar deep into history { if (TempIND[i]>TempIND[i-1] && // WAS THERE > TempIND[i+1]<=TempIND[i]) // Peak identified WAS THERE <= { ArrayResize(PeakUP, kup+1); // Resize the peak array according to the number of peaks identified ArrayResize(TimeUP, kup+1); // Resize the peak time array according to the number of peaks PeakUP[kup]=TempIND[i]; // Write its value into the peak array... TimeUP[kup]=iTime(sy,tf,i); // ...and the time array kup++; // Increase the peak array index } } //==================================================================================================== // --------------------------- Identification of the lower minimum and main DN extremum -----------------+ //==================================================================================================== PivotTimeDN = TimeDN[pbar]; // Time of the main extremum PivotBarDN = iBarShift(sy,tf,TimeDN[pbar]); // Bar of the main extremum PivotPeakDN = PeakDN[pbar]; // Value of the main extremum LowestPeakDN = ArrayMin(PeakDN); // Get the lower minimum value Index = ArraySearchDouble(PeakDN, LowestPeakDN); // Get the index of the lower minimum in the array LowestBarDN =iBarShift(sy,tf,TimeDN[Index]); // Get the bar of the lower minimum LowestTimeDN = TimeDN[Index]; // Get the time of the lower minimum if (LowestBarDN>PivotBarDN) // If the minimum is to the left of the first extremum ... // ... (being in 0 cell of the trough time array) for (m=Index-1; m>pbar; m--) // Loop from the extremum following the minimum to the first extremum { // --------- Draw a virtual trend line and check it for crossovers with other extrema ---------- CheckCross=EquationDirect(iBarShift(sy,tf,TimeDN[m+1]), PeakDN[m+1], // First coordinate of the line PivotBarDN, PivotPeakDN, // Second coordinate of the line iBarShift(sy,tf,TimeDN[m],false));// Crossing point associated with the next extremum if (TempIND[iBarShift(sy,tf,TimeDN[m])]<CheckCross) // If the extremum lies below the line { if (PeakDN[m]<PeakDN[pbar]) // if this extremum is lower than the main extremum { LowestBarDN =iBarShift(sy,tf,TimeDN[m]); // Then this is the one we need to start from... LowestPeakDN = PeakDN[m]; // New coordinates of the next extremum LowestTimeDN = TimeDN[m]; } } } if (LowestBarDN>PivotBarDN && LowestPeakDN<PivotPeakDN) // If the minimum is to the left of and below the main extremum { // --------------- Draw an uptrend line for adjustment (DN - extrema) --------------------- if (WinID>0) { if (ObjectFind("Trend_GLine_DN")<0) ObjectCreate("Trend_GLine_DN",OBJ_TREND,WinID,LowestTimeDN,LowestPeakDN,PivotTimeDN,PivotPeakDN); ObjectSet("Trend_GLine_DN",OBJPROP_COLOR,Lime); ObjectSet("Trend_GLine_DN",OBJPROP_TIME1,LowestTimeDN); ObjectSet("Trend_GLine_DN",OBJPROP_PRICE1,LowestPeakDN); ObjectSet("Trend_GLine_DN",OBJPROP_TIME2,PivotTimeDN); ObjectSet("Trend_GLine_DN",OBJPROP_PRICE2,PivotPeakDN); } //---------------- Calculation of levels of the uptrend (DN - extrema) ---------------- yGDN =EquationDirect(LowestBarDN, LowestPeakDN,PivotBarDN, PivotPeakDN, iBarShift(sy,tf,iTime(sy,tf,1),false)); yGDN2=EquationDirect(LowestBarDN, LowestPeakDN,PivotBarDN, PivotPeakDN, iBarShift(sy,tf,iTime(sy,tf,2),false)); //---------------- Draw levels of the uptrend (DN - extrema) ------------------ if (WinID>0) { if (ObjectFind("PointGDN"+iTime(sy,tf,1))<0) ObjectCreate("PointGDN"+iTime(sy,tf,1),OBJ_ARROW,WinID,iTime(sy,tf,1),yGDN); ObjectSet("PointGDN"+iTime(sy,tf,1),OBJPROP_ARROWCODE,4); ObjectSet("PointGDN"+iTime(sy,tf,1),OBJPROP_COLOR,Lime); ObjectSet("PointGDN"+iTime(sy,tf,1),OBJPROP_TIME1,iTime(sy,tf,1)); ObjectSet("PointGDN"+iTime(sy,tf,1),OBJPROP_PRICE1,yGDN); } // --------------- Check for a downward crossover of the uptrend ----------------- if (NormalizeDouble(TempIND[1],8) < NormalizeDouble(yGDN,8) && NormalizeDouble(TempIND[2],8) >= NormalizeDouble(yGDN2,8)) { CrossGDN = true; // Set the flag indicating the downward crossover CrossGUP = false; // Remove the flag indicating the upward crossover if (Arrow) // If the use of signal indicators is allowed { if (ObjectFind("ArrowGDN"+iTime(sy,tf,1))<0) ObjectCreate("ArrowGDN"+iTime(sy,tf,1),OBJ_ARROW, 0 ,iTime(sy,tf,1), iHigh(sy,tf,1)+5*pt); ObjectSet("ArrowGDN"+iTime(sy,tf,1),OBJPROP_ARROWCODE,242); ObjectSet("ArrowGDN"+iTime(sy,tf,1),OBJPROP_COLOR,OrangeRed); ObjectSet("ArrowGDN"+iTime(sy,tf,1),OBJPROP_WIDTH,1); ObjectSet("ArrowGDN"+iTime(sy,tf,1),OBJPROP_TIME1,iTime(sy,tf,1)); ObjectSet("ArrowGDN"+iTime(sy,tf,1),OBJPROP_PRICE1,iHigh(sy,tf,1)+5*pt); } } // --------------- Check for an upward crossover of the uptrend ----------------- if (add) { if (NormalizeDouble(TempIND[1],8) > NormalizeDouble(yGDN,8) && NormalizeDouble(TempIND[2],8) <= NormalizeDouble(yGDN2,8)) { CrossGUP = true; CrossGDN = false; if (Arrow) // If the use of signal indicators is allowed { if (ObjectFind("ArrowGUP"+iTime(sy,tf,1))<0) ObjectCreate("ArrowGUP"+iTime(sy,tf,1),OBJ_ARROW, 0 ,iTime(sy,tf,1), iLow(sy,tf,1)); ObjectSet("ArrowGUP"+iTime(sy,tf,1),OBJPROP_ARROWCODE,241); ObjectSet("ArrowGUP"+iTime(sy,tf,1),OBJPROP_COLOR,Lime); ObjectSet("ArrowGUP"+iTime(sy,tf,1),OBJPROP_WIDTH,0); ObjectSet("ArrowGUP"+iTime(sy,tf,1),OBJPROP_TIME1,iTime(sy,tf,1)); ObjectSet("ArrowGUP"+iTime(sy,tf,1),OBJPROP_PRICE1,iLow(sy,tf,1)); } } } } //==================================================================================================== // -------------------- Identification of the upper maximum and main UP extremum ----------------------+ //==================================================================================================== PivotTimeUP = TimeUP[pbar]; // Time of the main extremum PivotBarUP = iBarShift(sy,tf,TimeUP[pbar]); // Bar of the main extremum PivotPeakUP = PeakUP[pbar]; // Value of the main extremum HighestPeakUP = ArrayMax(PeakUP); // Get the value of the upper maximum Index = ArraySearchDouble(PeakUP, HighestPeakUP); // Get the index of the upper maximum in the array HighestBarUP =iBarShift(sy,tf,TimeUP[Index]); // Get the bar of the upper maximum HighestTimeUP = TimeUP[Index]; // Get the time of the upper maximum if (HighestBarUP>PivotBarUP) // If the maximum is to the left of the first extremum ... // ... (being in 0 cell of the peak time array) for (m=Index-1; m>pbar; m--) // Loop from the extremum following the maximum to the first extremum { // --------- Draw a virtual trend line and check it for crossovers with other extrema ---------- CheckCross=EquationDirect(iBarShift(sy,tf,TimeUP[m+1]), PeakUP[m+1], // First coordinate of the line PivotBarUP, PivotPeakUP, // Second coordinate of the line iBarShift(sy,tf,TimeUP[m],false)); // Crossing point associated with the next extremum if (TempIND[iBarShift(sy,tf,TimeUP[m])]>CheckCross) // If the extremum lies above the line { if (PeakUP[m]>PeakUP[pbar]) // if this extremum is higher than the main extremum { HighestBarUP =iBarShift(sy,tf,TimeUP[m]); // Then this is the one we need to start from... HighestPeakUP = PeakUP[m]; // New coordinates of the next extremum HighestTimeUP = TimeUP[m]; } } } if (HighestBarUP>PivotBarUP && HighestPeakUP>PivotPeakUP) // If the maximum is to the left of the main extremum { // ---------------- Draw a downtrend line (UP - extrema) --------------------- if (WinID>0) { if (ObjectFind("Trend_Line_GUP")<0) ObjectCreate("Trend_Line_GUP",OBJ_TREND,WinID,HighestTimeUP,HighestPeakUP,PivotTimeUP,PivotPeakUP); ObjectSet("Trend_Line_GUP",OBJPROP_COLOR,OrangeRed); ObjectSet("Trend_Line_GUP",OBJPROP_TIME1,HighestTimeUP); ObjectSet("Trend_Line_GUP",OBJPROP_PRICE1,HighestPeakUP); ObjectSet("Trend_Line_GUP",OBJPROP_TIME2,PivotTimeUP); ObjectSet("Trend_Line_GUP",OBJPROP_PRICE2,PivotPeakUP); } //---------------- Calculation of levels of the downtrend (UP - extrema) ------------------ yGUP =EquationDirect(HighestBarUP, HighestPeakUP, PivotBarUP, PivotPeakUP, iBarShift(sy,tf,iTime(sy,tf,1),false)); yGUP2=EquationDirect(HighestBarUP, HighestPeakUP, PivotBarUP, PivotPeakUP, iBarShift(sy,tf,iTime(sy,tf,2),false)); //---------------- Draw levels of the downtrend (UP - extrema) ------------------ if (WinID>0) { if (ObjectFind("PointGUP"+iTime(sy,tf,1))<0) ObjectCreate("PointGUP"+iTime(sy,tf,1),OBJ_ARROW,WinID,iTime(sy,tf,1),yGUP); ObjectSet("PointGUP"+iTime(sy,tf,1),OBJPROP_ARROWCODE,4); ObjectSet("PointGUP"+iTime(sy,tf,1),OBJPROP_COLOR,OrangeRed); ObjectSet("PointGUP"+iTime(sy,tf,1),OBJPROP_TIME1,iTime(sy,tf,1)); ObjectSet("PointGUP"+iTime(sy,tf,1),OBJPROP_PRICE1,yGUP); } // --------------- Check for an upward crossover of the downtrend ----------------- if (NormalizeDouble(TempIND[1],8) > NormalizeDouble(yGUP,8) && NormalizeDouble(TempIND[2],8) <= NormalizeDouble(yGUP2,8)) { CrossGUP = true; // Set the flag indicating the upward crossover CrossGDN = false; // Remove the flag indicating the downward crossover if (Arrow) // If the use of signal indicators is allowed { if (ObjectFind("ArrowGUP"+iTime(sy,tf,1))<0) ObjectCreate("ArrowGUP"+iTime(sy,tf,1),OBJ_ARROW, 0 ,iTime(sy,tf,1), iLow(sy,tf,1)); ObjectSet("ArrowGUP"+iTime(sy,tf,1),OBJPROP_ARROWCODE,241); ObjectSet("ArrowGUP"+iTime(sy,tf,1),OBJPROP_COLOR,Lime); ObjectSet("ArrowGUP"+iTime(sy,tf,1),OBJPROP_WIDTH,1); ObjectSet("ArrowGUP"+iTime(sy,tf,1),OBJPROP_TIME1,iTime(sy,tf,1)); ObjectSet("ArrowGUP"+iTime(sy,tf,1),OBJPROP_PRICE1,iLow(sy,tf,1)); } } // --------------- Check for a downward crossover of the downtrend ----------------- if (add) { if (NormalizeDouble(TempIND[1],8) < NormalizeDouble(yGUP,8) && NormalizeDouble(TempIND[2],8) >= NormalizeDouble(yGUP2,8)) { CrossGDN = true; CrossGUP = false; if (Arrow) // If the use of signal indicators is allowed { if (ObjectFind("ArrowGDN"+iTime(sy,tf,1))<0) ObjectCreate("ArrowGDN"+iTime(sy,tf,1),OBJ_ARROW, 0 ,iTime(sy,tf,1), iHigh(sy,tf,1)+15*pt); ObjectSet("ArrowGDN"+iTime(sy,tf,1),OBJPROP_ARROWCODE,242); ObjectSet("ArrowGDN"+iTime(sy,tf,1),OBJPROP_COLOR,OrangeRed); ObjectSet("ArrowGDN"+iTime(sy,tf,1),OBJPROP_WIDTH,0); ObjectSet("ArrowGDN"+iTime(sy,tf,1),OBJPROP_TIME1,iTime(sy,tf,1)); ObjectSet("ArrowGDN"+iTime(sy,tf,1),OBJPROP_PRICE1,iHigh(sy,tf,1)+15*pt); } } } } //жжжжжжжжжжжжжжжжжжжжжжжжжжжжжжжжжжжжжжжжжжжжжжжжжжжжжжжжжжжжжжжжжжжжжжжжжжжжжжжжжжжжжжжжжжж // ========================================================================================== // ------------------ Identification of two (local) outermost lower DN extrema -----------------+ // ========================================================================================== if (local) { asize=ArraySize(PeakDN); for (l=asize-1; l>=1; l--) { if (PeakDN[l]<PeakDN[l-1]) { LastTimeDN =TimeDN[l-1]; LastVarDN =PeakDN[l-1]; PreLastTimeDN =TimeDN[l]; PreLastVarDN =PeakDN[l]; } } // --------------- Draw a local uptrend line (DN - extrema) --------------------- if (WinID>0) { if (ObjectFind("Trend_Line_DN")<0) ObjectCreate("Trend_Line_DN",OBJ_TREND,WinID,TimeDN[1],PeakDN[1],TimeDN[0],PeakDN[0]); ObjectSet("Trend_Line_DN",OBJPROP_COLOR,MediumSeaGreen); ObjectSet("Trend_Line_DN",OBJPROP_TIME1,PreLastTimeDN); ObjectSet("Trend_Line_DN",OBJPROP_PRICE1,PreLastVarDN); ObjectSet("Trend_Line_DN",OBJPROP_TIME2,LastTimeDN); ObjectSet("Trend_Line_DN",OBJPROP_PRICE2,LastVarDN); } //---------------- Calculation of levels of the local uptrend (DN - extrema) ---------------- yDN =EquationDirect(iBarShift(sy,tf,PreLastTimeDN,false), PreLastVarDN, iBarShift(sy,tf,LastTimeDN,false), LastVarDN, iBarShift(sy,tf,iTime(sy,tf,1),false)); yDN2=EquationDirect(iBarShift(sy,tf,PreLastTimeDN,false), PreLastVarDN, iBarShift(sy,tf,LastTimeDN,false), LastVarDN, iBarShift(sy,tf,iTime(sy,tf,2),false)); //---------------- Draw levels of the local uptrend (DN - extrema) ------------------ if (WinID>0) { if (ObjectFind("PointDN"+iTime(sy,tf,1))<0) ObjectCreate("PointDN"+iTime(sy,tf,1),OBJ_ARROW,WinID,iTime(sy,tf,1),yDN); ObjectSet("PointDN"+iTime(sy,tf,1),OBJPROP_ARROWCODE,4); ObjectSet("PointDN"+iTime(sy,tf,1),OBJPROP_COLOR,MediumSeaGreen); ObjectSet("PointDN"+iTime(sy,tf,1),OBJPROP_TIME1,iTime(sy,tf,1)); ObjectSet("PointDN"+iTime(sy,tf,1),OBJPROP_PRICE1,yDN); } // --------------- Check for a downward crossover of the local uptrend ----------------- if (NormalizeDouble(TempIND[1],8) < NormalizeDouble(yDN,8) && NormalizeDouble(TempIND[2],8) >= NormalizeDouble(yDN2,8)) { CrossDN = true; CrossUP = false; if (Arrow) // If the use of signal indicators is allowed { if (ObjectFind("ArrowDN"+iTime(sy,tf,1))<0) ObjectCreate("ArrowDN"+iTime(sy,tf,1),OBJ_ARROW, 0 ,iTime(sy,tf,1), iHigh(sy,tf,1)+15*pt); ObjectSet("ArrowDN"+iTime(sy,tf,1),OBJPROP_ARROWCODE,242); ObjectSet("ArrowDN"+iTime(sy,tf,1),OBJPROP_COLOR,Chocolate); ObjectSet("ArrowDN"+iTime(sy,tf,1),OBJPROP_WIDTH,1); ObjectSet("ArrowDN"+iTime(sy,tf,1),OBJPROP_TIME1,iTime(sy,tf,1)); ObjectSet("ArrowDN"+iTime(sy,tf,1),OBJPROP_PRICE1,iHigh(sy,tf,1)+15*pt); } } // --------------- Check for an upward crossover of the local uptrend ----------------- if (add) { if (NormalizeDouble(TempIND[1],8) > NormalizeDouble(yDN,8) && NormalizeDouble(TempIND[2],8) <= NormalizeDouble(yDN2,8)) { CrossUP = true; CrossDN = false; if (Arrow) // If the use of signal indicators is allowed { if (ObjectFind("ArrowUP"+iTime(sy,tf,1))<0) ObjectCreate("ArrowUP"+iTime(sy,tf,1),OBJ_ARROW, 0 ,iTime(sy,tf,1), iLow(sy,tf,1)); ObjectSet("ArrowUP"+iTime(sy,tf,1),OBJPROP_ARROWCODE,241); ObjectSet("ArrowUP"+iTime(sy,tf,1),OBJPROP_COLOR,MediumSeaGreen); ObjectSet("ArrowUP"+iTime(sy,tf,1),OBJPROP_WIDTH,0); ObjectSet("ArrowUP"+iTime(sy,tf,1),OBJPROP_TIME1,iTime(sy,tf,1)); ObjectSet("ArrowUP"+iTime(sy,tf,1),OBJPROP_PRICE1,iLow(sy,tf,1)); } } } } //==================================================================================================== // ------------------------- Identification of two (local) outermost upper UP extrema ------------------+ //==================================================================================================== if (local) { asize=ArraySize(PeakUP); for (l=asize-1; l>=1; l--) { if (PeakUP[l]>PeakUP[l-1]) { LastTimeUP =TimeUP[l-1]; LastVarUP =PeakUP[l-1]; PreLastTimeUP =TimeUP[l]; PreLastVarUP =PeakUP[l]; } } // ---------------- Draw a local downtrend line (UP - extrema) --------------------- if (WinID>0) { if (ObjectFind("Trend_Line_UP")<0) ObjectCreate("Trend_Line_UP",OBJ_TREND,WinID,TimeUP[1],PeakUP[1],TimeUP[0],PeakUP[0]); ObjectSet("Trend_Line_UP",OBJPROP_COLOR,Chocolate); ObjectSet("Trend_Line_UP",OBJPROP_TIME1,PreLastTimeUP); ObjectSet("Trend_Line_UP",OBJPROP_PRICE1,PreLastVarUP); ObjectSet("Trend_Line_UP",OBJPROP_TIME2,LastTimeUP); ObjectSet("Trend_Line_UP",OBJPROP_PRICE2,LastVarUP); } //---------------- Calculation of levels of the local downtrend (UP - extrema) ------------------ yUP =EquationDirect(iBarShift(sy,tf,PreLastTimeUP,false), PreLastVarUP, iBarShift(sy,tf,LastTimeUP,false), LastVarUP, iBarShift(sy,tf,iTime(sy,tf,1),false)); yUP2=EquationDirect(iBarShift(sy,tf,PreLastTimeUP,false), PreLastVarUP, iBarShift(sy,tf,LastTimeUP,false), LastVarUP, iBarShift(sy,tf,iTime(sy,tf,2),false)); //---------------- Draw levels of the local downtrend (UP - extrema) ------------------ if (WinID>0) { if (ObjectFind("PointUP"+iTimeiTimesy,tf,1))<0) ObjectCreate("PointUP"+iTime(sy,tf,1),OBJ_ARROW,WinID,iTime(sy,tf,1),yUP); ObjectSet("PointUP"+iTime(sy,tf,1),OBJPROP_ARROWCODE,4); ObjectSet("PointUP"+iTime(sy,tf,1),OBJPROP_COLOR,Chocolate); ObjectSet("PointUP"+iTime(sy,tf,1),OBJPROP_TIME1,iTime(sy,tf,1)); ObjectSet("PointUP"+iTime(sy,tf,1),OBJPROP_PRICE1,yUP); } // --------------- Check for an upward crossover of the local downtrend ----------------- if (NormalizeDouble(TempIND[1],8) > NormalizeDouble(yUP,8) && NormalizeDouble(TempIND[2],8) <= NormalizeDouble(yUP2,8)) { CrossUP = true; CrossDN = false; if (Arrow) // If the use of signal indicators is allowed { if (ObjectFind("ArrowUP"+iTime(sy,tf,1))<0) ObjectCreate("ArrowUP"+iTime(sy,tf,1),OBJ_ARROW, 0 ,iTime(sy,tf,1), iLow(sy,tf,1)); ObjectSet("ArrowUP"+iTime(sy,tf,1),OBJPROP_ARROWCODE,241); ObjectSet("ArrowUP"+iTime(sy,tf,1),OBJPROP_COLOR,MediumSeaGreen); ObjectSet("ArrowUP"+iTime(sy,tf,1),OBJPROP_WIDTH,1); ObjectSet("ArrowUP"+iTime(sy,tf,1),OBJPROP_TIME1,iTime(sy,tf,1)); ObjectSet("ArrowUP"+iTime(sy,tf,1),OBJPROP_PRICE1,iLow(sy,tf,1)); } } // --------------- Check for a downward crossover of the local downtrend ----------------- if (add) { if (NormalizeDouble(TempIND[1],8) < NormalizeDouble(yUP,8) && NormalizeDouble(TempIND[2],8) >= NormalizeDouble(yUP2,8)) { CrossDN = true; CrossUP = false; if (Arrow) // If the use of signal indicators is allowed { if (ObjectFind("ArrowDN"+iTime(sy,tf,1))<0) ObjectCreate("ArrowDN"+iTime(sy,tf,1),OBJ_ARROW, 0 ,iTime(sy,tf,1), iHigh(sy,tf,1)+15*pt); ObjectSet("ArrowDN"+iTime(sy,tf,1),OBJPROP_ARROWCODE,242); ObjectSet("ArrowDN"+iTime(sy,tf,1),OBJPROP_COLOR,Chocolate); ObjectSet("ArrowDN"+iTime(sy,tf,1),OBJPROP_WIDTH,0); ObjectSet("ArrowDN"+iTime(sy,tf,1),OBJPROP_TIME1,iTime(sy,tf,1)); ObjectSet("ArrowDN"+iTime(sy,tf,1),OBJPROP_PRICE1,iHigh(sy,tf,1)+15*pt); } } } } // ----------------------------------------------------------------------------------------------------------- // The conditions here can be represented by CrossGUP and CrossGDN, as well as CrossUP and CrossDN. // In the first case, we have a "global trend" on all specified bars, // in the second case, we have local trends on the last two extrema. // You can also combine signals of crossovers of "global" and "local" trends in the A/D chart /* if (CrossGUP && CrossUP) return(11); // An upward crossover of both downtrends else if (CrossGDN && CrossDN) return(-11); // A downward crossover of both uptrends else if (CrossGUP) return(10); // An upward crossover of the "global" downtrend else if (CrossGDN) return(-10); // A downward crossover of the "global" uptrend else if (CrossUP) return(1); // An upward crossover of the "local" downtrend else if (CrossDN) return(-1); // A downward crossover of the "local" uptrend */ if (CrossGUP || CrossUP) return(1); else if (CrossGDN || CrossDN) return(-1); else return(0); }
The code above is almost the same as the one we have already analyzed; I will therefore only comment on the input parameters of the function and method of calling it.
int SignalCrossIND(double &TempIND[], int nBars, string sy, int tf, bool local=false, bool add=false, bool Arrow=true)
In contrast to the earlier reviewed code, we have here added another variable of the bool type - Arrow that displays signal indicators in the main window of the terminal. The value by default is set to true, i.e. if the arrows are to be displayed in the chart, this parameter can be left out when calling the function.
In the general case, the function call can be as follows. Insert the below line in the global variables of an EA:
double TempIND[]; // Array for storing indicator data
Then, specify the desired number of bars of history for identification of extrema in the A/D indicator chart in the function for receiving trading signals
int nBrs=30;
or, for example
int nBrs=200;
Here, everything depends on what TF trend lines are going to be plotted on and how many bars of history we are going to process. The bigger the value, the more "stable" the trend lines would be in the A/D chart, yet the more delayed the crossover signal would become.
And finally the function call per se:
int sig=0;
   sig=SignalCrossIND(TempIND, nBrs, NULL, 5, false, false, true);

   if (sig==1)
      {Code for opening a Buy position}
   if (sig==-1)
      {Code for opening a Sell position}
The parameter values passed here suggest that the data is to be obtained from the current chart of the currency instrument (NULL), the time frame to be used is М5 (5), local trend lines are not to be plotted and no crossovers of these lines are to be looked for (false), further, no crossover in the direction of the trend is to be looked for (false), while the signal indicators (up/down arrows) are to be displayed in the main chart window (true).
Since all of these are default values, the following function call will be considered absolutely identical:
sig=SignalCrossIND(TempIND, nBrs, NULL, 5);
Conclusion
To conclude the above, I would like to say that this function is by no means an independent trading strategy. It is merely a function for identification of crossovers of trend lines plotted in the A/D indicator chart and indicator line. It may well be used in an EA along with other functions.
To see its capabilities, I carried out a test over the interval from 01.01.2009 to 01.01.2010. The test was carried out using only the values returned by this function. I disabled the EA's signal module and replaced it with this function alone. The number of bars for the identification of extrema = 250. The time frame = 5, the symbol selected was EURUSD, the initial deposit was 10000, the fixed lot was 0.1.
I also disabled the use of SL and TP. I only left the trailing stop that closes positions partially over three times upon reaching the set profit level (which, naturally, is different for each of three stages). Positions were opened upon getting a signal from the function.
The opposite position was in this case not getting closed. Upon receipt of the new signal in the direction of the already existing position, I had to determine the time that elapsed after the previous position had opened, and if it was over 7 minutes, a new position was getting opened. Put shortly, I used the deposit to the maximum... :) Another thing I almost forgot to mention is that in order to close all positions at once, I used an equity increase by a set percentage. I set it to 5 % in this test.
The resulting chart representing data over one year is as follows:
It is clear that it cannot be applied in a real account, yet, I believe, there is a core of sense in it (all the more so as it is just a signal function).
And finally, I would like to express my deep, sincere gratitude to Viktor (Vinin) and Aleksey (Mathemat) for their selfless help and a true friendly support, as well as to all those who in one way or another contribute to solving different programming issues.
Translated from Russian by MetaQuotes Ltd.
Original article: https://www.mql5.com/ru/articles/1357
 How to Make a Trading Robot in No Time
 Application of the Eigen-Coordinates Method to Structural Analysis of Nonextensive Statistical Distributions
 Introduction to the Empirical Mode Decomposition Method
- Free trading apps
- Over 8,000 signals for copying
- Economic news for exploring financial markets
You agree to website policy and terms of use
I'm sorry for my English.
thanks
Accumulation/Distribution is supposed to be created from changes of price and volume. Metatrader does not provide true volume in the market sense, it substitutes that with a simple tick count, so how can this indicator be any use to us when loaded into metatrader ?