Benefiting from Forex market seasonality
Seasonal trends in the foreign exchange market reflect cyclical price changes. They are based on factors that repeat over a period of time. The Forex market has seasonal trends associated with economic events such as holidays or agricultural seasons in certain industries.
Seasonality in Forex means predictable price behavior depending on the time of year.
1. Seasonal analysis
This is a trading strategy aimed at finding and working out long-term patterns, which are expressed in the repetition of trends on the same time interval.
Seasonality is a phenomenon where price experiences similar and predictable changes during the same period each calendar year. These changes may occur during a particular meteorological season, crop season, quarter, month, holiday period or off-peak period. Seasonal analysis is characteristic of the commodity market. For example, there is a seasonal trend in the demand for heating oil, which increases prices when demand rises and decreases when demand falls. There is a seasonal trend in the supply of soybeans (associated with planting, growing and harvesting) that influences prices by creating patterns.
Seasonality also occurs in other markets, such as stocks, indices and Forex, usually for fundamental reasons. Identifying seasonal patterns and using them to forecast trends, identify trade ideas or identify a trading opportunity can give a trader an edge. Note how seasonality itself can vary and change over the course of different years. Whether used alone or in combination with other methods, seasonal analysis is an undeniably useful tool.
Seasonality is a factor that affects almost all areas of life. In financial markets, the seasonality effect is also visible. In many ways, seasonal fluctuations in stock markets repeat themselves in the Forex market. Here, seasonality appears to be a predictable formation of a market model, depending on the time of year, repeating at regular intervals associated with the patterns of financial, political and other functioning of markets.
Typically, the foreign exchange market changes quite quickly, trends tend to unfold, changing directions, creating dangers and room for traders to maneuver. But there are certain periods, in which not only fundamental and technical analysis, but also taking into account the seasonality factor will allow you to trade effectively.
There is a lot of data to consider when making trading decisions. Even more charts and numbers come into play when professional analysts work on strategies with a technical approach. However, multiple complex statistics can drown out some of the easier-to-understand data - seasonal trends in Forex are an interesting factor.
It is worth remembering, however, that, in fact, every month could potentially be interesting in trading certain trading symbols throughout the year.
The change of seasons has a serious impact on any aspect of human life. Trading in the foreign exchange market is also subject to significant fluctuations due to seasonality. Perhaps, this tool remains poorly understood and rarely used in practice. This is due to the underestimation of its use.
The basis of any exchange rate fluctuations is a change in the balance of supply and demand. The regular change of seasons forces some factors to equally influence the exchange rate of a particular country almost every season.
The most striking sign of the influence of seasonality on the Forex market is the change in the exchange rate of the currencies of oil-producing countries during periods of increased demand for oil, usually this occurs during the periods of sowing campaigns or harvesting of the finished crop.
The money of natural gas exporters increases in value as cold weather approaches, etc.
2. What is taken into account when trading seasonally?
Today there are two large groups of traders in the foreign exchange market. Some of them rely on currency trading when choosing a strategy, using only news reports. Others use technical analysis as the main tool for developing a concept, avoiding making trades at the time of important political and financial events. The seasonality factor allows us to distinguish two areas of decision-making when making transactions:
-
management of graphical models displaying certain patterns;
-
application of fundamental factors based on identifying supply and demand.
The use of seasonal analysis allows the trader to combine these directions into a single whole, since established trends in supply and demand perfectly help in building price models. Therefore, one must take into account the following rules when trading on the currency exchange:
Caution. It is necessary to carefully approach currency trading when a trend is detected, because large players in the Forex market can deliberately mislead participants through various manipulations in order to obtain additional benefits. Therefore, we need to rely only on reliable and verified sources when taking into account seasonal factors.
Comprehensive analysis. Before making transactions, we need to pay attention to fundamental and technical analysis data. Seasonal changes in exchange rate very often depend on climatic conditions, especially when it comes to crops. Therefore, the more nuances are taken into account, the higher the likelihood of success.
Regularity of seasonal fluctuations
Seasonal trends can be used in a trading strategy, but they should be used with great caution as there is a high chance of mistakes. However, if the analysis confirms the season’s trend, follow your intuition. Knowledge of the principles of seasonality allows you to conclude interesting deals. Moreover, based on the practice of applying a seasonal approach to trading, periods from a week to a month are generally used. Next, an exit from positions occurs and the beginning of consideration of entry according to the next seasonal trends on different instruments.
Seasonal fluctuations in the foreign exchange market occur for several main reasons:
-
fluctuations in commodity markets, where seasonality reflects patterns of demand and supply for commodities and futures;
-
a significant number of closing transactions on the U.S. stock market to optimize taxes with the subsequent restoration of positions at the beginning of next year.
Before accepting seasonal patterns for working on Forex, you need to pay attention to what reasons were driving the creation of a seasonal trend. This is necessary to subsequently determine the direction of the currency pair movement.
Thus, seasonality is a too risky trend, adherence to which for a trader can cause the loss of the entire deposit. A seasonal trend has fewer factors that can be forecast to determine turning points, support and resistance levels. As we know, intuitive trading is one of the main dangers of traders who rely only on luck.
The seasonal factor in the foreign exchange market is an additional filter that you can use to refine your trading strategy and tactics.
Tips for using easonal factors in the Forex market
Using cycles and seasonal factors in the Forex market can be very beneficial for traders. However, there are some guidelines that can help you use these factors correctly and reduce risks.
1. How to select suitable seasonal factors for analysis?
Various aspects such as economic events, seasonality of industries and characteristics of currency pairs need to be studied and researched. Additionally, you can use historical data to determine price behavior over a period of time and highlight seasonal trends.
2. How to use the information received to make decisions about buying or selling currency? If the trend indicates an increase in the price of a currency pair, you can consider opening a long position. If the price is expected to decline, consider taking a short position. However, you can learn about other factors such as technical analysis and fundamental data.
There are some repeating cycles in routine purchase markets: increased demand for holiday items drives up prices leading up to the holidays, only to have the opposite happen immediately afterwards. The same is true for travel and related services.
The seasonality of the stock and commodity markets has long been known. The described principle works in a similar way on Forex, following the same laws of changes in supply and demand. There are patterns.
The Forex market is no different and has its own ups and downs. However, they are not easily detected using traditional chronological assessment. Comparing sequential data will show general trends for a particular currency or pair over a period of time, but if we take data for the same month over 5, 10 or 15 years, some trends will emerge. For some currency pairs more than others, it is clear that currency trading has peak and unsuccessful months with uncertain patterns without clearly visible seasonality.
The charts will look different for different currency pairs, so we will go into more detail with specific examples. We will take a few trading symbols and look at the seasonal trends they show.
Seasonality plays a significant role when USD exchange rate against other currencies either rises or falls rapidly. Research and proper use of different types of market analysis will help achieve the desired result.
Seasonality in Forex means price movements that repeat at certain times of the year. Of course, this does not mean that this will always be the case and that the movements will be repeated.
3. Characteristic movements of trading symbols depending on seasonality
EUR/USD
With EUR being the second most used currency in the world, it is no surprise that the EURUSD pair is also one of the most popular for trading. Although the market conditions for these currencies are highly dependent on the economic cycle, seasonal trends are visible over long time periods.
The chart below and the accompanying seasonal trend indicator show the performance of the EUR/USD over one, two, three, five, eight, 10 and 15 years. When you hover your cursor over one of the lines, you can see exactly what time period it displays average price data for. You can customize the color display of average prices for periods of time you deem necessary. I have configured it according to the most optimal option. As we can see, in a number of symbols there are medium-term patterns of the Forex market that allow us to observe trends.

As we can see seen from the chart, there are signs of growth towards the end of the year
USD/CAD
There are also signs of growth towards the end of the year, as shown in the figure below.
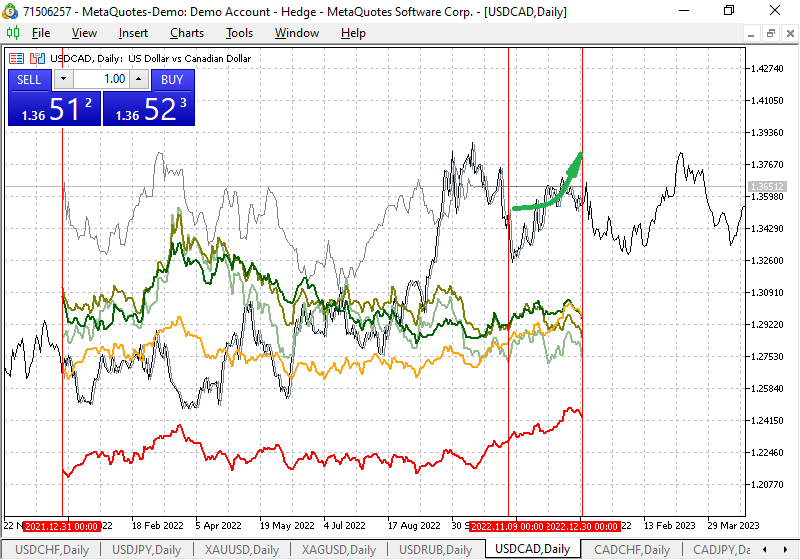
Fig. 2. Seasonal fluctuation chart for USDCAD
The beginning of November marks a temporary rise of this currency pair
GBP/USD seasonal trends
Since GBP has been trading against USD for the longest time, there is quite convincing evidence of seasonal trading trends for this pair on Forex.
The chart below shows the trends of the GBPUSD currency pair. However, you can rely on smaller timeframes, zooming in to find more subtle trends in any month of the year.

Fig. 3. Seasonal fluctuation chart for GBPUSD
According to this symbol, seasonal volatility appears in September and GBP rises against USD. This is due to the fact that vacations are ending and vigorous activity among traders and investors begins in Europe.
XAUUSD also shows growth dynamics by the end of the year
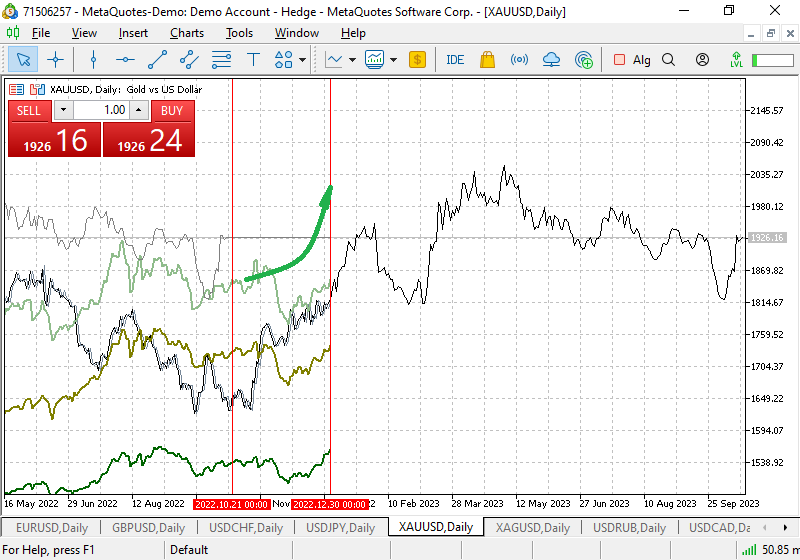
Fig. 4. Seasonal fluctuation chart for XAUUSD
Fig. 5 below shows a chart of the USDCHF currency pair movement with a seasonal movement potential of about 2000 points by the end of the year.
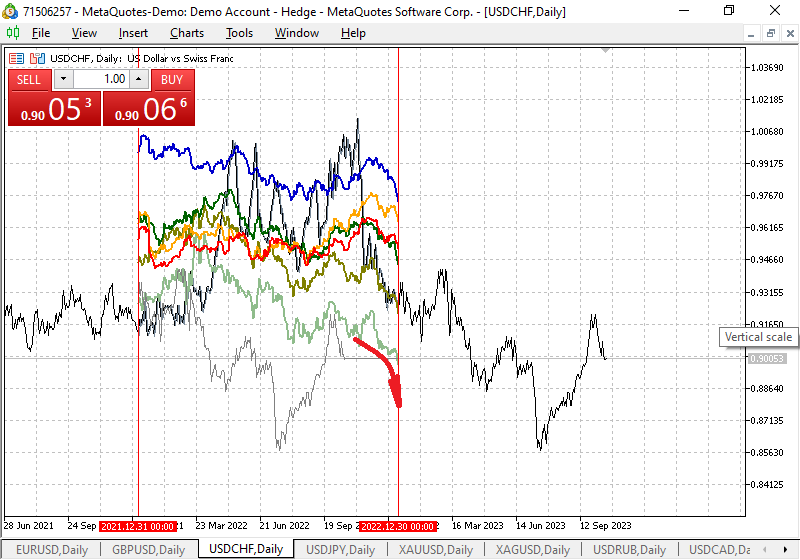
Fig. 5. Seasonal fluctuation chart for the USDCHF trading symbol
4. Seasonal trading strategies
There are four different seasons in a year, and there are seasonal patterns in the financial markets you can use in seasonal trading strategies. Seasonal trading refers to seasonal patterns that occur at regular intervals at specific intervals. Let's call them seasonal trading strategies for simplicity.
This article looks at why you can use seasonality in trading strategies (seasonal trading). Let's look at what seasonal trading is, why it happens. At the end, you will find a long list of seasonal stock trading strategies and how to use them.
If you are looking for an edge in trading the markets, seasonality can offer you some powerful and long-lasting advantages. Many of them cannot be used on their own, but together with other parameters, seasonality is an excellent trading tool.
Seasonality refers to patterns that occur at regular intervals during certain periods of time. Examination of time series data for many different assets shows that each trading symbol has its own characteristics or seasonality from time to time.
Does the seasonal trading pattern occur with some regularity?
No, seasonal changes do not occur with 100% regularity. There are statistics and averages.
For example, averages may indicate higher performance in winter than in summer, so we have a seasonal trading pattern. However, this does not mean that we see positive returns every winter. Although the seasonal trading pattern may have a very positive mean, this may be the result of spikes. If you have few observations to support seasonality, then even 2-3 observations can explain most of the results.
No seasonal trading pattern lasts forever.
The main reason for studying seasonality is that we believe that most of the anomalies you find in your backtests are seasonality in disguise. For example, Tuesday's reversal is largely a result of seasonality rather than an anomaly. Thus, a correlation in trading may turn out to be a hidden seasonality.
Another reason to use seasonality in trading is that it can be a very valuable input to strategies by combining other parameters.
Disadvantages of seasonal trading strategies
One of the disadvantages of many seasonal trading strategies is the number of observations, or lack thereof. Noise and randomness lurk around every corner in financial markets, and you must be careful not to jump to conclusions. The annual pattern obviously only happens once a year, and therefore you need 30 years just to get 30 observations. This is not confirmed by any statistical test.
The general rule in trading is to have as many observations as possible.
Another disadvantage is that markets are not stationary. Nothing lasts forever. The same applies to seasonality, and thus you have to compensate for losses in seasonality that stops working.
Seasonal changes in trading occur due to a variety of factors, including changing seasons and financial reporting periods, as well as seasonality of weather in commodity forward contract trading strategies.
The market consists of an unlimited number of causes and correlations and is therefore extremely complex to understand.
When something is labeled as seasonal, we associate it with weather and climate.
The commodity market, which is highly dependent on the weather, has many seasonal fluctuations.
Suggestion to readers - consider seasonal fluctuations in your broker's commodity forward contracts and share the patterns you find and the best way to use them in trading in the comments.
5. Using the seasonality indicator
To trade seasonally, we need a suitable graphical tool. The attached file to this article contains the seasonality indicator with a pattern of its use. The article discusses seasonal analysis on D1.
How to use seasonal analysis? There are different ways to identify the seasonal component, but the simplest and most reliable approach involves calculating average trends. Symbol quotes are taken for several years. After that, the prices of each day of the current year, last year, the year before, etc. are added up according to the corresponding dates of the years and divided by the number of years of averaging.
Fig. 6 shows the loading of the template onto the symbol chart:
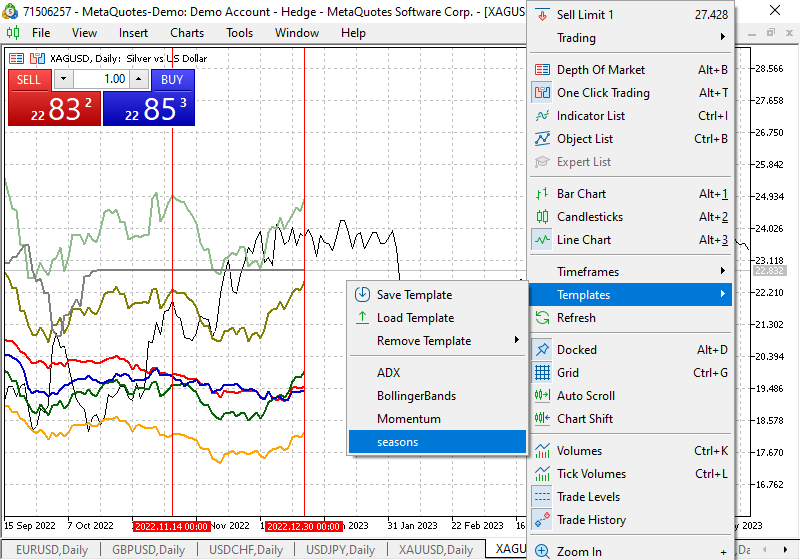
Fig. 6. Loading a template onto the symbol chart
To make it easier to understand the indicator readings (in the form of lines), we move on to the symbol chart to the previous year (the proposed indicator displays seasonal price movements of the symbol during the year). To construct the indicator, we took the closing prices of the symbol days during the current year (displayed on the period of the previous year for the ease of use), the previous year, as well as the average values of the symbol prices of 2, 3, 5, 8, 10 and 15 years. They are summed up and divided by the number of years of averaging. Each line displays the average price of a symbol over the period. When loading a template from the Templates folder of the terminal, two vertical lines will immediately appear on your screen, delimiting the beginning and end of the previous year to make it easier to understand seasonal trends. The indicator is used on D1. It shows "daily" seasonal variations throughout the year. You can use different colors and width of the lines for yourself, as you wish. The average symbol price values for the specified time periods are displayed. Essentially, they are average price values for the same period (month and day) of previous years. The price of the current year symbol is also displayed in gray in the form of a line. Each indicator line is labeled with a clear name
   PlotIndexSetString(0,PLOT_LABEL,"Last year");
   PlotIndexSetString(1,PLOT_LABEL,"Last year and the year before");
   PlotIndexSetString(2,PLOT_LABEL,"Average price over 3 years");
   PlotIndexSetString(3,PLOT_LABEL,"The current year's price is displayed on the previous year's period");
   PlotIndexSetString(4,PLOT_LABEL,"Average price over 5 years");
   PlotIndexSetString(5,PLOT_LABEL,"Average price over 8 years");
   PlotIndexSetString(6,PLOT_LABEL,"Average price over 10 years");
   PlotIndexSetString(7,PLOT_LABEL,"Average price over 15 years");
and the period for collecting the average symbol price values for plotting it on a seasonality chart shown as an example in Fig. 7, in a rectangular window when hovering the mouse arrow over the line. You can change and customize the color scheme of the lines at your discretion. The quotes of the current year for the period of the previous year (indicator display) are shown in gray to complete the picture of perception and assessment of seasonality. From the practice of using futures contracts in seasonality trading: the optimal period of holding a market position is from a week to a month, after which we should either increase it in the direction of seasonality, or reduce it, or make other trading decisions.
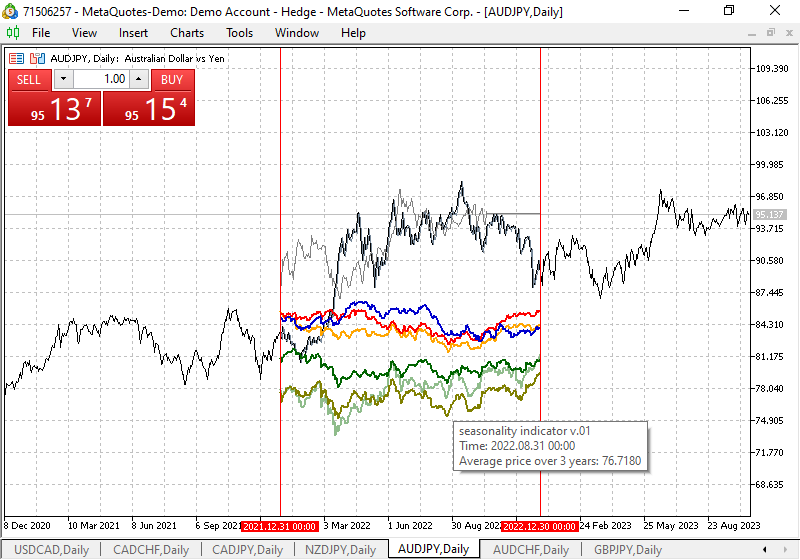
Fig. 7. Displaying the name of the indicator line with years of quote averaging
By changing the chart display scale on the D1 timeframe, it is possible to study in more detail the seasonal movements of the symbol throughout the year. For example, we see that often silver with a good movement potential from November of each year loses in price, which is shown in Fig. 8.
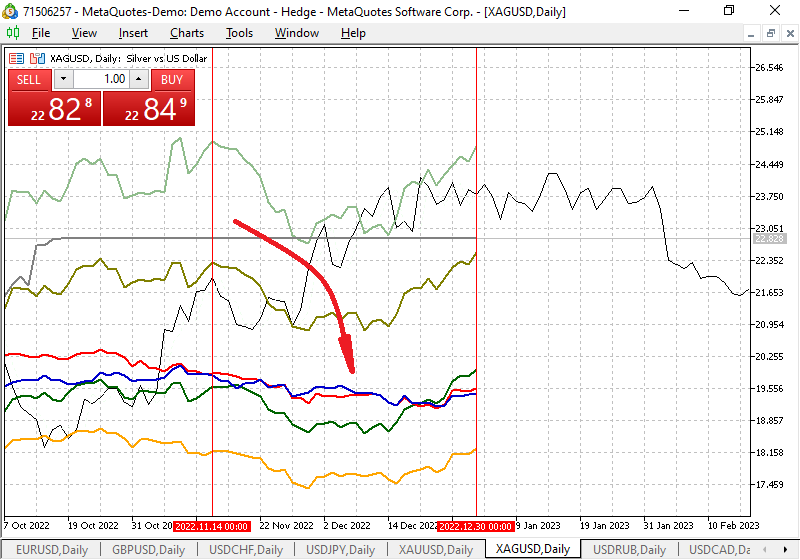
Fig. 8. Seasonal fluctuation chart for XAGUSD
Thanks to the given average values of currency pairs, taking the annual period as a basis, it is possible to track the patterns of movements at various intervals during the year for fifteen years. For ease of use of the indicator, the period of the nearest last year of the symbol was taken, which displays the dynamics of seasonal trends in the price of the symbol in the main window.
How is a chart of historical quotes constructed? The symbol price is averaged over a period of 2, 3, 5, 8, 10 and 15 years. Next, it is summed up and divided by the number of years of averaging. The indicator is designed for use on the daily timeframe.
If the indicator lines are not displayed immediately, you need to switch timeframes and return to D1 to view the seasonal price trends of the symbol.
As we see, the established concept of seasonal analysis as a purely fundamental tool is not entirely correct. We can evaluate the potential of an asset based on cycles of harvest, production and consumer demand growth. But at the same time, we can assess the seasonal outlook using technical analysis .
How can this data be applied in practice? Find patterns that repeat on the curves for 5, 10 and 15 years, i.e. sustainable ones. For example, USDJPY pair always rises from November to December. How can we benefit from this knowledge? When trading intraday this data will not help you, but if you trade on D1, then from November to December you can follow only buy signals for this pair while ignoring sell ones. In other words, you should trade in the direction of seasonality.
The topic of seasonal trends is quite fascinating. Up and down trends at the end and beginning of the year are easier to understand and explain than some complex technical analysis. But it is important to keep other factors in mind and not rely on any one of them in isolation.
Seasonal trends in the Forex market in most cases are the result of the overall balance of supply and demand in the commodity market. But these trends may also correlate with unknown market forces. Therefore, looking at longer periods of time would be a safer way to draw conclusions on a seasonal trend.
Conclusion
You can yourself evaluate the possible potential of symbol movement based on seasonality and share the patterns you find in the comments on the current date of the current year.
Keep in mind that no observation of seasonal trends can replace technical or fundamental analysis. In addition, the Forex market is just as susceptible to unpredictable changes and black swans as any other.
It is wise to consider seasonality as an additional filter for assessing trading patterns. The topic of seasonal trends is quite fascinating. Up and down trends at the end and beginning of the year are easier to understand and explain than some complex technical analysis. But it is important to keep other factors in mind and not rely on any one of them in isolation. You can consider the influence of seasonality on other symbols as well and report interesting results of observations and identified patterns.
It is important to analyze historical data to isolate cyclical and seasonal factors in price movements. Study price charts to see repeating patterns and trends. Use technical analysis to identify signals and confirm price movements based on cyclical and seasonal factors. Indicators, such as moving averages and stochastic oscillators, can help determine entry and exit points. Cyclical and seasonal factors can be caused not only by technical aspects, but also by fundamental factors. Study the economic calendar and events that may affect prices over a period of time. Using cyclical and seasonal factors to predict price changes requires attention and analysis.
Using seasonality in the Forex market can be an important tool in predicting price movements and making trading decisions.
Seasonality is also characteristic of other markets, for example, stocks, indices, usually for fundamental reasons. Identifying seasonal patterns and using them to forecast trends, identify trade ideas or identify a trading opportunity can give a trader an edge. Note how seasonality itself can vary and change over the course of different years. Whether used alone or in combination with other methods, seasonal analysis can be a useful tool in your trading toolkit.
Translated from Russian by MetaQuotes Ltd.
Original article: https://www.mql5.com/ru/articles/12996
 Neural networks are easy (Part 59): Dichotomy of Control (DoC)
- Free trading apps
- Over 8,000 signals for copying
- Economic news for exploring financial markets
You agree to website policy and terms of use