Revisiting an Old Trend Trading Strategy: Two Stochastic oscillators, a MA and Fibonacci
Introduction The Details of the Strategy
The strategy is purely technical and uses a few technical indicators and tools to deliver signals and targets. The components of the strategy are as follows:
- A 14-period stochastic oscillator.
- A 5-period stochastic oscillator.
- A 200-period moving average.
- A Fibonacci projection tool (for target setting).
The stochastic oscillator is a popular technical analysis tool used by traders and investors to measure the momentum and strength of a financial instrument’s price movements. It was developed by George C. Lane in the late 1950s. It is bounded between 0 and 100 with values close to the lower boundary being referred to as oversold levels (bullish bias) and values close to the upper boundary being referred to as overbought levels (bearish bias).
The 5-period stochastic oscillator in a daily timeframe is defined
as follows:

Where High and Low are the highest and lowest prices in the last 5 days respectively, while %D is the N-day moving average of %K (the last N values of %K). Usually this is a simple moving average, but can be an exponential moving average for a less standardized weighting for more recent values. There is only one valid signal in working with %D alone - a divergence between %D and the analyzed security.
A moving average is a commonly used statistical calculation that helps smooth out price data over a specified period of time. It is widely used in various fields, including finance, economics, and signal processing. In the context of financial markets, moving averages are frequently employed in technical analysis to identify trends and generate trading signals.
A moving average is calculated by taking the average (mean) of a set of prices over a given time frame and updating it as new data becomes available. As each new data point is added, the oldest data point is dropped, resulting in a “moving” average that reflects the most recent prices.
Implementing the Strategy
The trading rules of the strategy are as follows:
- A long signal is generated whenever both stochastic oscillator reach the oversold level at the same time, bounce, and then come back to it (around the same time). The whole process must be done while the market is above the 200-period moving average. The first target is set using the Fibonacci projection tool applied from the low of the first time the stochastic oscillators reached their bottom and the low of the second time they reached their bottom. The first target is therefore the 61.8% projection and the second target is the 100.0% projection.
- A short signal is generated whenever both stochastic oscillator reach the overbought level at the same time, bounce, and then come back to it (around the same time). The whole process must be done while the market is below the 200-period moving average. The first target is set using the Fibonacci projection tool applied from the high of the first time the stochastic oscillators reached their top and the high of the second time they reached their top. The first target is therefore the 61.8% projection and the second target is the 100.0% projection.
(I've implemented a change in the strategy, to have stop levels in each Fibonacci level)
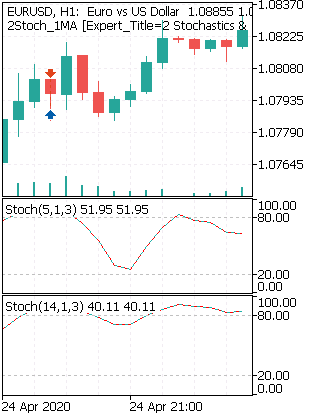
The following Figure shows a bearish signal:

Ultimately, the results may vary from market to market and the current results may not be stable. Strategies work during certain periods but may underperform during others.
The stop of the strategy is either half the target so that a 2.0 risk-reward ratio is achieved or whenever the market breaks the moving average line.
In finance, Fibonacci retracement is a method of technical analysis for determining support and resistance levels. It is named after the Fibonacci sequence of numbers, whose ratios provide price levels to which markets tend to retrace a portion of a move, before a trend continues in the original direction.
A Fibonacci retracement forecast is created by taking two extreme points on a chart and dividing the vertical distance by Fibonacci ratios. 0% is considered to be the start of the retracement, while 100% is a complete reversal to the original price before the move. Horizontal lines are drawn in the chart (not in this EA) for these price levels to provide support and resistance levels.
Common levels are 23.6%, 38.2%, 50% and 61.8%.
Results
Allthough this is a profitable strategy, it vary from market to market and the current results may not be stable. Strategies work during certain periods but may underperform during others. Please test the strategy before using, and modify values to best acheavement, like shift days or time period.
We can use this, to shift over all the data
   int Highest = iHighest(Symbol(),my_timeframe,MODE_CLOSE,shift,1);
   double High0=iHigh(Symbol(),my_timeframe,0);


   int Lowest = iLowest(Symbol(),my_timeframe,MODE_CLOSE,shift,1);
   double Low0=iLow(Symbol(),my_timeframe,0);
But for testing reasons, we will use a smaller shift value (for example 300).
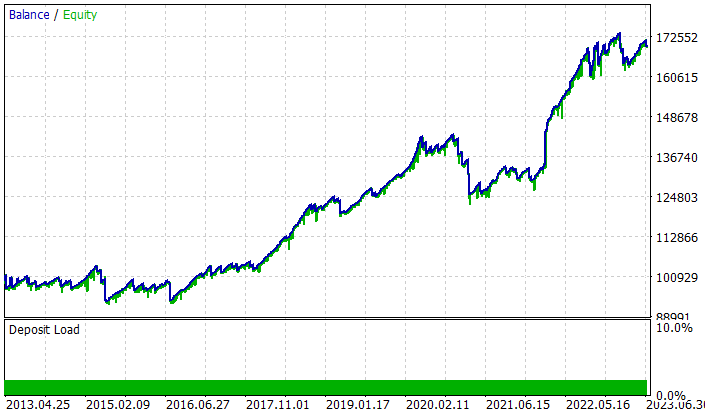
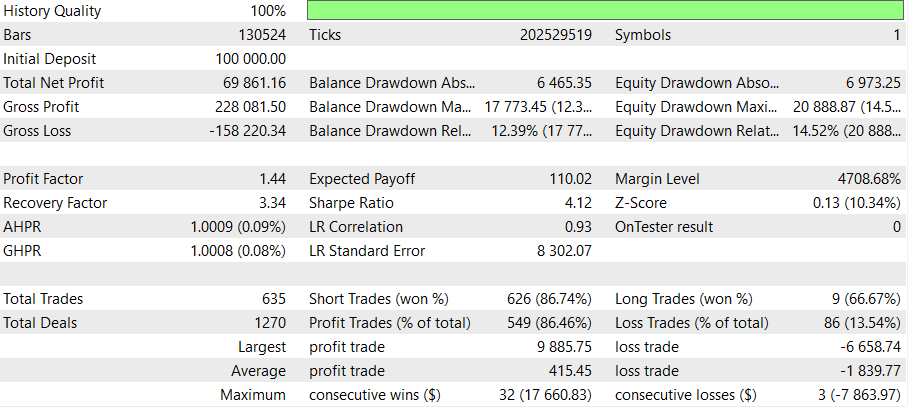
This are the results for shift =300, timeperiod = 30 minutes, and from 2013 to 2023 (20 of June) and a 2% risk.


In finance, the Sharpe ratio (also known as the Sharpe index or reward-to-variability ratio) measures the performance of an investment such as a security or portfolio compared to a risk-free asset, after adjusting for its risk. It is defined as the difference between the returns of the investment and the risk-free return, divided by the standard deviation of the investment returns. It represents the additional amount of return that an investor receives per unit of increase in risk.

Code
OnInit we will declare the technicals we are going to use, handles:
void OnInit()
  {
   Stochastic_handle1 = iStochastic(_Symbol, PERIOD_CURRENT, Signal_0_Stoch_PeriodK, Signal_0_Stoch_PeriodD, Signal_0_Stoch_PeriodSlow, MODE_SMA, STO_LOWHIGH);
   Stochastic_handle2 = iStochastic(_Symbol, PERIOD_CURRENT, Signal_1_Stoch_PeriodK, Signal_1_Stoch_PeriodD, Signal_1_Stoch_PeriodSlow, MODE_SMA, STO_LOWHIGH);

//--- create handle of the indicator iMA
   handle_iMA=iMA(_Symbol,PERIOD_CURRENT,Inp_MA_ma_period,Inp_MA_ma_shift,
                  Inp_MA_ma_method,Inp_MA_applied_price);


//Test

   Alert("Expert Advisor has been launched");

  }
This code creates a handle for a Stochastic indicator. The handle is called Stochastic_handle1. The iStochastic() function is used to create the handle. The parameters passed to the function are the symbol, the current period, the period for the %K line, the period for the %D line, the period for the slow line, the mode for the slow line, and the type of Stochastic (low/high).
This code is used to calculate the Moving Average (MA) of the current symbol with the specified parameters. The handle_iMA variable stores the result of the MA calculation. The parameters used in the calculation are the symbol, the current period, the MA period, the MA shift, the MA method, and the applied price. The symbol is the currency pair or security that the MA is being calculated for. The current period is the timeframe of the chart that the MA is being calculated for. The MA period is the number of bars used to calculate the MA. The MA shift is the number of bars to shift the MA calculation. The MA method is the type of MA calculation, such as Simple, Exponential, Smoothed, or Linear Weighted. The applied price is the price type used in the MA calculation, such as Close, Open, High, Low, Median, Typical, or Weighted.
We will have to input all those parameters, declared outside and before OnInit.
On OnTick we will use this, to get the values of each tick
   MqlTick tick;
   SymbolInfoTick(_Symbol,tick);
This code is used to retrieve the tick data for a given symbol. The first line declares a MqlTick variable called tick. The second line calls the SymbolInfoTick() function which takes two parameters, the symbol name and the tick variable. The function retrieves the tick data for the given symbol and stores it in the tick variable.
To simulate the Fibonacci retracement levels, we will use this:
int Highest = iHighest(Symbol(),my_timeframe,MODE_CLOSE,shift,1);
   double High0=iHigh(Symbol(),my_timeframe,0);


   int Lowest = iLowest(Symbol(),my_timeframe,MODE_CLOSE,shift,1);
   double Low0=iLow(Symbol(),my_timeframe,0);


   double highestValue = iHigh(Symbol(),my_timeframe,Highest);


   double lowestValue = iLow(Symbol(),my_timeframe,Lowest);
// Obtener el valor más alto y más bajo de la barra actual
   double currentHigh = High0;
   double currentLow = Low0;

// Obtener el valor más alto y más bajo de la barra anterior
   double previousHigh = highestValue;
   double previousLow = lowestValue;


   double level0s = currentHigh;
   double level1s = currentHigh - (currentHigh - previousLow) * 0.236;
   double level2s = currentHigh - (currentHigh - previousLow) * 0.382;
   double level3s = currentHigh - (currentHigh - previousLow) * 0.618;
   double level4s = previousLow;

   double level0b = currentLow;
   double level1b = currentLow + (-currentLow + previousHigh) * 0.236;
   double level2b = currentLow + (-currentLow + previousHigh) * 0.382;
   double level3b = currentLow + (-currentLow + previousHigh) * 0.618;
   double level4b = previousHigh;
This code in MQL5 language is used to determine the highest and lowest values of a given symbol and period. The first two lines of code assign the highest value of the symbol and period to the variable Highest and the highest value of the symbol and period at the given shift=0 to the variable High0 (current candle). The next two lines of code assign the lowest value of the symbol and period to the variable Lowest and the lowest value of the symbol and period at the given shift=0 to the variable Low0.
We will use a shift, to select how many candlesticks we will look back.
For the MA we will use this:
//---
   double array_ma[];
   ArraySetAsSeries(array_ma,true);
   int start_pos=0,count=3;
   if(!iGetArray(handle_iMA,0,start_pos,count,array_ma))
      return;
This code is used to retrieve an array of moving averages from a handle. The first line declares an array called array_ma which will be used to store the moving averages. The second line sets the array as a series. The third and fourth lines declare two integer variables, start_pos and count, which will be used to specify the starting position and the number of elements to be retrieved from the handle. The fifth line uses the iGetArray function to retrieve the moving averages from the handle and store them in the array_ma. The function returns false if the retrieval fails.
with this (out side the OnInit)
bool iGetArray(const int handle,const int buffer,const int start_pos,
               const int count,double &arr_buffer[])
  {
   bool result=true;
   if(!ArrayIsDynamic(arr_buffer))
     {
      //if(InpPrintLog)
      PrintFormat("ERROR! EA: %s, FUNCTION: %s, this a no dynamic array!",__FILE__,__FUNCTION__);
      return(false);
     }
   ArrayFree(arr_buffer);
//--- reset error code
   ResetLastError();
//--- fill a part of the iBands array with values from the indicator buffer
   int copied=CopyBuffer(handle,buffer,start_pos,count,arr_buffer);
   if(copied!=count)
     {
      //--- if the copying fails, tell the error code
      //if(InpPrintLog)
      PrintFormat("ERROR! EA: %s, FUNCTION: %s, amount to copy: %d, copied: %d, error code %d",
                  __FILE__,__FUNCTION__,count,copied,GetLastError());
      //--- quit with zero result - it means that the indicator is considered as not calculated
      return(false);
     }
   return(result);
  }
This code is used to copy a part of an indicator buffer into an array. It takes in five parameters, a handle, a buffer, a start position, a count, and an array buffer. It first checks if the array buffer is dynamic, and if not, it prints an error message. It then resets the error code and copies the buffer into the array buffer. If the amount copied is not equal to the count, it prints an error message and returns false. Otherwise, it returns true.
That prints errors, and to show the results on the graph, we will use this:
   string text="";
   for(int i=0; i<count; i++)
      text=text+IntegerToString(i)+": "+DoubleToString(array_ma[i],Digits()+1)+"\n";
//---
   Comment(text);
This code is used to print out the values of an array of type double in MQL5 language. The code starts by declaring a string variable called “text” and setting it to an empty string. Then, a for loop is used to iterate through the array, with the variable “i” being used as the loop counter. For each iteration, the value of “i” is converted to a string using the IntegerToString() function, and the value of the array at that index is converted to a string using the DoubleToString() function. The Digits() function is used to determine the number of decimal places to use when converting the double value to a string. The converted values are then concatenated to the “text” string, with a new line character added after each value. Finally, the Comment() function is used to print out the “text” string.
We will do the same with both Stochastics.
We will set up conditions to not have more than one order opened at the same time, we will use this
   int total = PositionsTotal();

   if(total==0)
{
...code
}

   if(total>0)
{
...code
}
To make orders, we will use this:
if(!trade.Buy(get_lot(tick.bid),_Symbol,tick.bid,newStopLossLevelb1,newTakeProfitLevelb2))
                 {
                  //--- failure message
                  Print("Buy() method failed. Return code=",trade.ResultRetcode(),
                        ". Code description: ",trade.ResultRetcodeDescription());
                 }
               else
                 {
                  Print("Buy() method executed successfully. Return code=",trade.ResultRetcode(),
                        " (",trade.ResultRetcodeDescription(),")");
                 }
Where we will use tick.bid, and the SL and TP consecuently. The TP will be the highest high of the shift period, and the SL will be the losw of actual candel.
To close the order when the price crosses the MA, we will use this:
if(rates[1].close >array_ma22[0])
           {

            trade.PositionClose(_Symbol,5);
            Print("cerro");
            return;
           }
         else
            return;

        }
To modify the TP and SL we will use this:
            //--- setting the operation parameters
            request.action  =TRADE_ACTION_SLTP; // type of trade operation
            request.position=position_ticket;   // ticket of the position
            request.symbol=position_symbol;     // symbol
            request.sl      =newStopLossLevelss;                  // Stop Loss of the position
            request.tp      =newTakeProfitLevelss;               // Take Profit of the position
            request.magic=Expert_MagicNumber;         // MagicNumber of the position
            //--- output information about the modification
            PrintFormat("Modify #%I64d %s %s",position_ticket,position_symbol,EnumToString(type));
            //--- send the request
            if(!OrderSend(request,result))
               PrintFormat("OrderSend error %d",GetLastError());  // if unable to send the request, output the error code
            //--- information about the operation
            PrintFormat("retcode=%u  deal=%I64u  order=%I64u",result.retcode,result.deal,result.order);
Remember, to use the freeze level and stop level. Also take into account to use modify both TP and SL or an error will appear.
I've added stopLoss levels to all the Fibonacci levels, so results may differ from original start. After reading this code, you will be able to modify the code and change those levels.
Conclusion
This strategy can be profitable in some time periods, but can also be underperforming under other circumstances. During the 2008-2014 crisis and de 2020 Covid crisis, the strategy was poor, so, just take that into consider if you use this strat.
This strategy works well during not crisis times and trend periods.
It gives a Ratio Sharpe arround 4, this means that the strategy is at leas robust, and the finance to evaluate risk-adjusted performance is considered very good and near to excellent.
This strategy can be used as complement for other strategys.
You can modify this strategy as you want, and I beleave it can get better results.
Remember, the aim of this article is to help people understand the strategy. This strategy is not for use, if you use it, its on your own risk.
I recommend you test this bot over more time frames and over other symbols
Using other time periods will probably give different results.
- Free trading apps
- Over 8,000 signals for copying
- Economic news for exploring financial markets
You agree to website policy and terms of use
That's probably the article I have read with the worst code I have ever seen, no offense intended, just facts. Don't use that ever on a live account.
What are you thinking this is doing ?
There is no real volume data on most symbols, except on Futures and Stocks. On Forex this will always return 1. Highest is always = 1.
Then you are using this index (Highest obtained on real volume) to get the a High value :
You are mixing things which should not be mixed (unless you know what you are doing). How is a "High" price value related to a real volume ?
Anyway, it will always give the same as High[1] which apparently is what you was trying to get. But then why not get it directly without this diversions through iHighest and real volume ?
I will not go further. You said :
the aim of this article is to help people understand how to program in MQL5
If someone want to understand how to program in MQL5, I would recommend to avoid this article at all prices.
I explain the strategy, that is my aim. You can code you're own program. That is just an example. I'm in the situation of having to show resuls, that is why I upload a simple EA. The real aim is to show the strategy.
Yes, you are right, this is not usefull to learn programming, this is just to show a strategy.
Agreed with Alain on that, worst coder I've seen too. Here is the fix if that could help: (replace the first part of OnTick() function)
The explanation is clear but the code has a lot of unnecessary declarations and lines.
I don't see where the MA condition is compared and the Stochastic condition converging with the MA trend indication.
Please point it out, maybe the code can modified and simplified.
I ran the EA, unfortunately it does not execute trades.