Data Science and Machine Learning (Part 04): Predicting Current Stock Market Crash
Introduction
In Part 02 of this article series we created a simple logistic model based on the titanic data, today we are going to build a logistic model that could help us predict the Market crash
In this article, we are going to make a useful application of our logistic models by making a predictive model of the stock market crash, to test our model we are going to use the test data on the current stock market crash, I think that will be relevant to all of us.
Stock Market Crash
A stock market crash is a sharp and quick drop in the total value of the market with prices typically declining more than 10% within a few days, Famous examples of major stock market crashes are the black Monday in 1987 and the real estate bubble in 2008. A crash is usually attributable to the burst of a price bubble and is due to a massive sell-off that occurs when a majority of the stock market participants try to sell off their assets at the same time.
Before we get further into this thing I want to give a disclaimer on this:
This is not a financial or trading advice. Hopefully, you believe that I am not Mr. buffet or Charlie Munger, or a professional stock market investor, I'm just a data scientist finding a way to relate scientific models into trading kindly do not take things seriously in this article as the majority of these views have been gathered online and from various trusted sources linked to the reference section at the end of the article do your research before you decide to use any of the approach discussed in this article to make trading decisions
Now we got that out of the way, let's move on.
First of all, let's see the factors that affect the stock prices, once we understand these factors we will have somewhere to start because these factors could be used as our data ( Independent variables ) for our logistic model.
Factors that Affect Stock Prices
there are many factors affecting the stock market the following are just a few. Keep in mind there has never been a clear indicator of how the markets behave the way they do, so I am going to use the following factors,
- Supply and Demand
- Company Related factors
- Interest Rates
- Current Events
- Inflation
01: Supply and Demand
There are many factors affecting the stock market, but if you strip all that's on the outside and look at the very basic factor, it is simple, supply and demand, An imbalance between supply and demand will raise and lower the price of the stock
If there is a sudden scarcity of apples, more and more people are lining up to buy them, and the price of apples will immediately skyrocket
similarly, if the company is doing well and everyone wants to buy shares of the same company, there will be a shortage of shares leading to the shooting up of the stock price of a company, And the opposite is true if there are too many shares but nobody wants to buy them, the stock price will plummet in that case.
It is impossible (I might say) for us to get all the supply and demand data that we can use in our model so, we are going to leave this factor behind in our dataset, but I believe anyone who could be able to get this data accurately, is one step closer to building the holy grail
02: Company Related factors
Anything that happens within the company will directly affect the share price, if the company is on the rise, with successful product launches, increased revenue, reduced debt, and more influx of investors then the price of a company is bound to increase because everyone would want to buy shares of such company that is going from a spike to a spike
However, if a company is recording losses, having product failures, and increased debt, then a majority of shareholders would want to dump shares of the company hence reducing the stock price
A good example to make this point clear is Netflix and Apple,
We watched Netflix lose over 200,000 service subscribers within the first 3 months of 2022, due to increased prices sanctions to some of the members, and many other situations that occurred within the company which lead directly the stock price of Netflix to fall
Apple on the other end has been a successful company for a very long time due to successful product releases, good leadership in the company, and other positive situations inside the company which led to a bullish stock price in recent years
To determine the company's health we are going to use a metric that's called the Price-to-earnings ratio
Price-To-Earnings Ratio
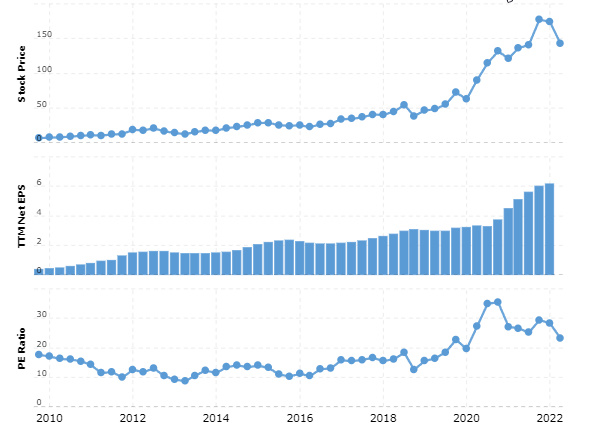
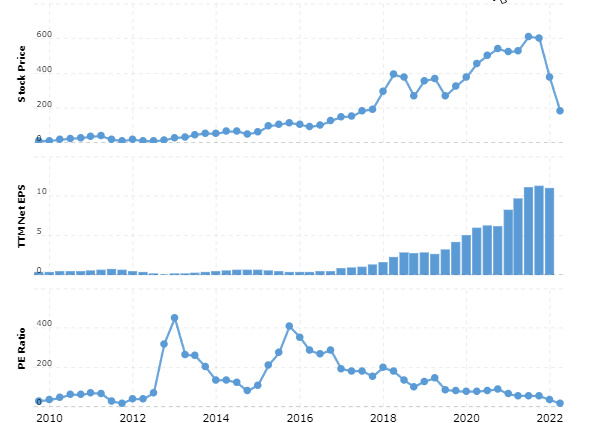
Price-to-earnings ratio for valuing a company that measures its current share price relative to its earnings per share (EPS). The PE ratio can be used as an indicator of how healthy a company is Here is how the charts look like based on stock prices and the PE ratio for Apple and Netflix
APPLE:
data source: macrotrends.net
NETFLIX
data source: macrotrends.net
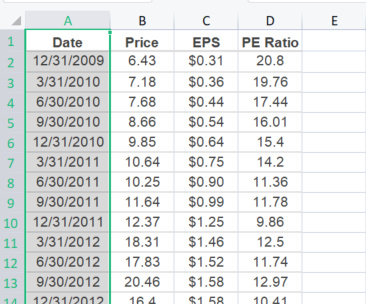
It appears that the PE ratio gets calculated quarterly in a year so in this case, it appears that that was all the free sources of data could offer I guess there is more to paid sources, we might consider that our data has some holes in it, since we need to have the same number of rows in all of our dataset columns for our calculations in our models to work effectively, this is the data for APPLEL:
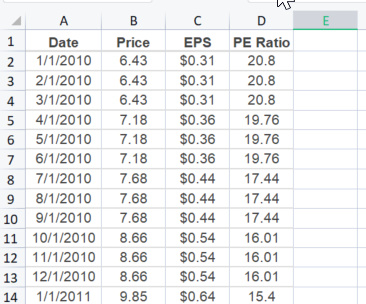
if data is calculated in every quarter of a year then for the rest of the quarter we will be using the same data that was pre-calculated until the next quarter, so in this case, let's duplicate the data:
The same actions will be performed for NETFLIX.
03: Interest Rates
The on-goings at the federal reserve bank directly affect the stock prices, the reserve banks keep changing rates at regular intervals to stabilize the economy. Naturally, a higher interest rate means that companies will have to pay more for loans, resulting in lesser profits, This will reduce their stock price Inversely, lower interest rates means that companies can borrow money from banks for much lesser costs thus saving their money and making a higher profit, In this case, the prices of stocks will go up
> The fed is recently raising rates to destroy demand and force businesses to decrease their prices and ultimately help inflation to come down.
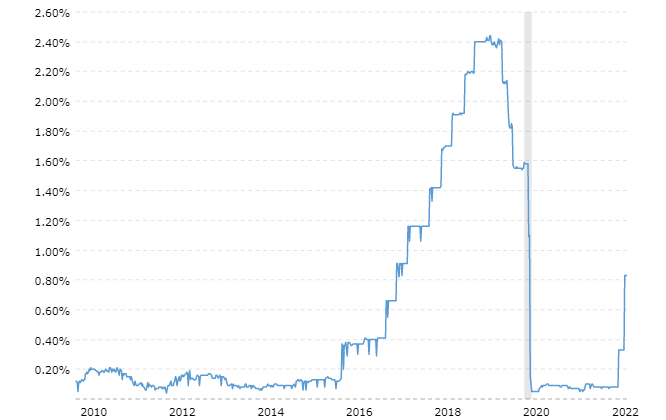
The graph of fed's funds rate from 2010 to today looks like this:
04: Current Events
the ongoing events around the country or the world, in general, can have a massive impact on the stock market as well, Nobody can deny that the covid-19 pandemic had a very strong negative effect on the stock market in the late 2019 and 2020, and the riots for equality in the US in the same year,
other events affecting the stock market price include wars and terrorist attacks
All these events are bound to make stock prices go down drastically and affect the market volatility
I am not going to collect any data from this factor, because it would require so much work and more models to train for these events, this is beyond the scope of what we have already covered in this article series.
05: Inflation
Inflation is the decline of purchasing power of a given currency over time. A quantitative estimate of the rate at which the decline in purchasing power occurs can be reflected in the increase of an average price level of a basket of selected goods and services in an economy over some period of time. The rise in the general level of prices often expressed as a percentage, means that a unit of currency effectively buys less than it did in prior periods.
Read more about inflation here https://www.investopedia.com/terms/i/inflation.asp
So basically, there are two types of inflation Core CPI and CPI:
- Core CPI - is everything except energy and food prices
- CPI - is everything inside the economy; energy, food prices, education, entertainment, etc. Everything that exists in people of a specific economy day to day life
As inflation erodes the value of a dollar of earnings, it can make it difficult for the market to gauge the current value of the companies that make up market indexes. Further, higher prices for materials, inventory, and labor can impact earnings as companies adjust. As a result, stock prices can fluctuate, and this causes volatility.
The good news is that while Fed tightening can negatively impact fixed-income investments, equities have often historically done well during these cycles.
looking at the US CPI chart since 1970.
Now, let's collect all the necessary data and store them in one CSV file .
Starting with APPLE:
Collecting the Data
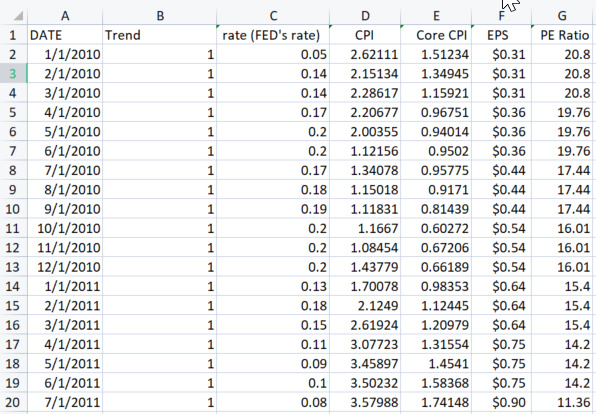
The data we are going to collect for our CSV file is Core CPI, CPI, Fed's fund's rate, EPS, and PE Ratio I have all this data available
Only one data remaining missing in our dataset, and that is our dependent variable, but we only have the raw values of stock prices, Let's create a script that could tell us if a specific month had a stock market crash or not
inside CrashClassifyScript.mq5
void DetectCrash(double &prices[], int& out_binary[])
 {
     double prev_high = prices[0];

     ArrayResize(out_binary,ArraySize(prices)-1); //we reduce the size by one since we ignore the current we predict the previous one
     for (int i=1; i<ArraySize(prices); i++)
        {
           int prev = i-1;
            if (prices[i] >= prev_high)
                prev_high = prices[i]; //grab the highest price

            double percent_crash = ((prev_high - prices[i]) / prev_high) * 100.0; //convert crash to percentage
            printf("crash percentage %.2f high price %.4f curr price %.4f ", percent_crash,prev_high,prices[i]);

            //based on the definition of a crash; markets has to fall more than 10% percent
            if (percent_crash > 10)
                out_binary[prev] = 0; //downtrend (crash)
            else
                out_binary[prev] = 1; //uptrend (no crash )
        }
 }
if you pay attention on the first prev_high you'll notice that I have primarily given it the value of previous price that is because I have copied the apple values from December 1,2009, instead of January 1,2010 I wanted to have a room to detect the crash at first calculation and by adding that month, it has become possible, but we ignore that month to our output dataset because we no longer need it, that's why the out_binary[prev] index prev on the inside which is basically i-1 because we loop starting at the index of 1
here is the output when we print the output binary Array
CrashClassifyScript DATE 1/1/2010 TREND 1
CrashClassifyScript DATE 2/1/2010 TREND 1
.........
CrashClassifyScript DATE 4/1/2022 TREND 0
CrashClassifyScript DATE 5/1/2022 TREND 0
Adding all the data columns to one csv file in excel, will result to a csv file that looks like this
GREAT, Now it's all set let's start to work with some more code.
We all know that behind the scenes of our logistic model, there is a linear regression algorithm and before we can use any data in a linear model we have to check if it correlates with its independent variable let's check it by calling the method corrcoeff that I have added to our LinearRegression Library that I created in the previous article.
Inside TestScript.mq5
m_lr = new CMatrixRegression;

Print("Matrix multiple regression");
m_lr.Init(8,"2,4,5,6,7",file_name,",",0.7);

m_lr.corrcoeff();
m_lr.MultipleMatLinearRegMain();
delete m_lr;
The output will surely be:
Matrix multiple regression
TestScript Init, number of X columns chosen =5
TestScript "2" "4" "5" "6" "7"
TestScript All data Array Size 740 consuming 52 bytes of memory
TestScript Correlation Coefficients
TestScript Independent Var Vs Trend = 0.225
TestScript Independent Var Vs CPI = -0.079
TestScript Independent Var Vs Core CPI = -0.460
TestScript Independent Var Vs EPS($) = -0.743
TestScript Independent Var Vs PE Ratio = -0.215
It appears that all the data I just collected on different places doesn't correlate with the Price of the stock, despite a lot of people online screaming that these are the factors that affect the stock market, I understand that the sources gave a disclaimer initially that there is no clear indicator on how the markets do what they do but the numbers for a linear model show a very different story, for instance, the CPI versus the Price of Apple, I was expecting to have a very strong negative correlation here but it appears that the correlation too weak to be used in linear regression, only the core CPI is showing promising negative correlation of about -0.46 The strongest of all is EPS (Earnings per share) showing the negative correlation of about 0.743 which may be converted to -74.3%
Let's not end there, It is super important to visualize the data in python and see for yourself just in case we are missing something from the numbers, in case our calculations didn't go well:

output
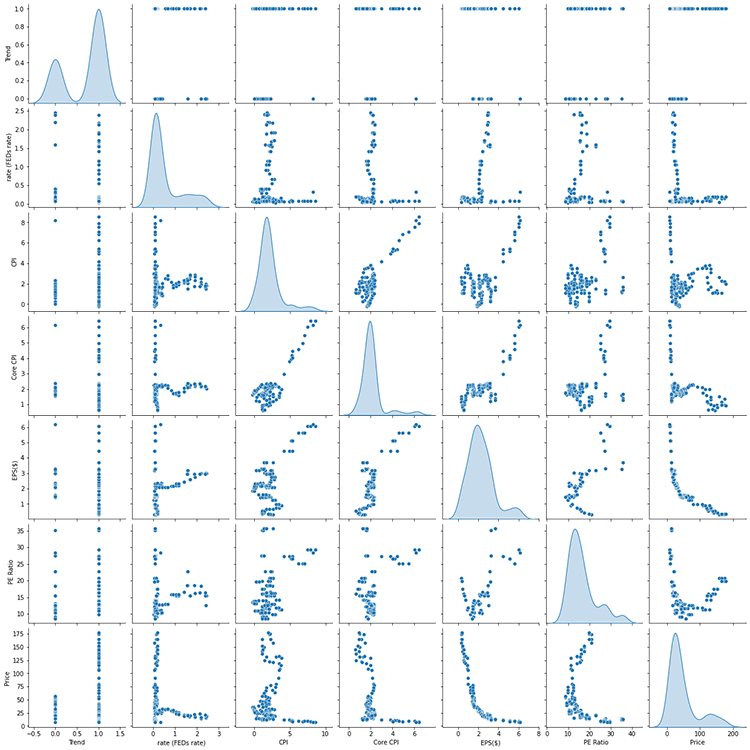
I think to this point, It's very clear that there is not much of a strong relationship between most of the data we collected let's filter our data,
We are going to use only the three independent variables to build up our model which are,
- Core CPI (correlates with about -46% near a half)
- EPS (correlates with about -74.2% best correlated than all the data)
- Lastly, the FEDs fund rate (correlates with about -33%, least correlated I wouldn't recommend this when you are building a serious model )
Okay, now let's initialize our library with only the columns that we want:
log_reg.Init(file_name,delimiter,2,"3,5,6",0.7);
For those that missed the basic functionality of logistic regression should refer to this Article.
Further Improvement on the library
//These should be called before the Init

void    FixMissingValues(string columns);
void    LabelEncoder(string columns, string members);
logistic models are sensitive to missing values and since it is a classifying machine learning model, it treats zero data which may indicate that the data is missing as a classified class, it can also treat nan values and strings as zero's depending on how we read the files in MQL5, that's why I made some improvement's to the library,
The function to replace the missing values with the mean and the function to encode the strings into labels,
these functions should be called before the Init function
Now our logistic library Inherits, the components from our MatrixRegression library that we created in the previous Article
class CLogisticRegression: protected CMatrixRegression
let's get to the good part and see how good our model is,

The output will be
  Confusion Matrix
   [ 0  13 ]
    [  0  31  ]
  Tested model accuracy =0.7045
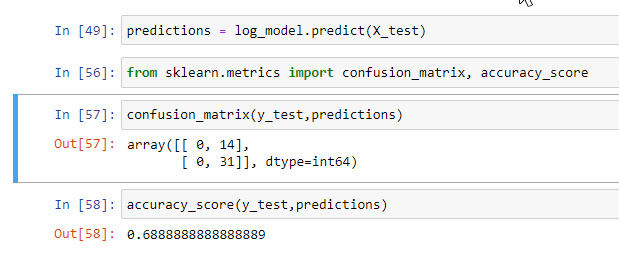
Our model Accuracy is 70.45% on the Testing data set 😲 I'm dumbfounded at this point
I thought because of the data drawback I had earlier I could not hit even the 50% mark, I thought there has to be an error at some point until I tried the same thing with python just to achieve the same result
B A M
keep in mind, that our dependent variable is the Trend column that we collected with our script to detect the crash, early in this Article, The price column was just used to show of the correlations coefficients for our linear models because we can't use the binary values of 0 and 1 that indicate the trend down and up respectively to find correlations it is rather the real prices on the Stock in that instance
Now, let's shift the focus to NETFLIX
Here is how correlation coefficient numbers look like for this brother here,
        Correlation Coefficients
         Independent Var Vs Trend = 0.071
         Independent Var Vs  rate (FEDs rate) = 0.310
         Independent Var Vs CPI = 0.509
         Independent Var Vs Core CPI  = 0.607
         Independent Var Vs  EPS = 0.917
         Independent Var Vs PE Ratio = -0.213
It appears that the majority of the factors we discussed below, affects NETFLIX positively only negative being Price to Earnings Ratio, The strongest factor being Earnings Per share with correlation of about 92% to the stock price, Others being core CPI and CPI, so for NETFLIX we are going to use only three data to build our Model:
- EPS
- Core CPI
- and CPI
Again let's visualize our data.
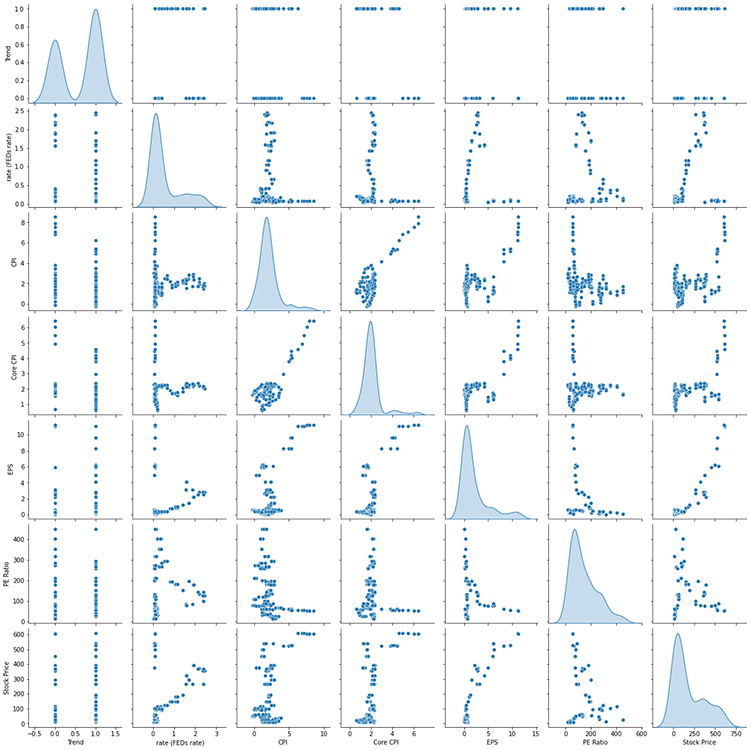
It looks a lot better on NETFLIX than it was on apple last time,
Long story short,
   log_reg = new CLogisticRegression();

    Print("NETFLIX");

    file_name =  "Netflix Dataset.csv";

    log_reg.Init(file_name,delimiter,2,"4,5,6",0.7);
    log_reg.LogisticRegressionMain(accuracy);

    printf("Tested model accuracy =%.4f",accuracy);
    delete log_reg;
the output
FN      0       07:54:45.106    TestScript      NETFLIX
PN      0       07:54:45.108    TestScript      ==== TRAINED LINEAR REGRESSION MODEL COEFFICIENTS ====
ED      0       07:54:45.108    TestScript      [
RO      0       07:54:45.108    TestScript       1.43120 -0.05632 -0.54159  0.48957
EE      0       07:54:45.108    TestScript      ]
CQ      0       07:54:45.108    TestScript      columns = 4 rows = 1
PH      0       07:54:45.108    TestScript      ========= LINEAR REGRESSION MODEL TESTING STARTED =========
QP      0       07:54:45.108    TestScript      Tested Linear Model R square is = -0.35263665822405277
GR      0       07:54:45.108    TestScript      Confusion Matrix
EE      0       07:54:45.108    TestScript       [ 0  18 ]
HN      0       07:54:45.108    TestScript        [  0  26  ]
MJ      0       07:54:45.108    TestScript      Tested model accuracy =0.5909
Despite having data that had a strong linear correlation to the stock price, the NETFLIX model has a lower accuracy of about 60% compared to the Accuracy of the APPLE model of 70% you can play with the rest of the dataset on your own and see how the model might look like
Realtime Stock Market Testing
to be able to test on the live market inside our Expert Advisor we need to make some modifications to our main LogisticRegression Function, we need to make the function store the predicted values with their respective dates in a CSV file that we will use in the strategy tester to pull he signals on where the market will go according to our model.
Here is how we will gather the data and store it to a csv file:
WriteToCSV(TestPredicted,dates,"Predicted "+m_filename,m_delimiter); Remember, we are only collecting the testing dataset results.
Here is the brief view on how the data is stored in a csv file:
NETFLIX

Predicted, date_time
1,8/1/2018
1,9/1/2018
1,10/1/2018
1,11/1/2018
1,12/1/2018
1,1/1/2019

APPLE

Predicted, date_time
1,9/1/2018
1,10/1/2018
1,11/1/2018
1,12/1/2018
1,1/1/2019
1,2/1/2019
If you paid attention to the confusion Matrix Part, you'll notice that our model is a good predictor of the upward trend, The TP (true positive had a large number of all the matrix rows in the Matrix).
Realtime Stock Price Testing EA
The first step is to creating our EA is to collect data from our CSV file, but before that, we want to let our strategy tester know that we are going to use this file while testing.
#property tester_file "Predicted Apple Dataset.csv"
Now, Just a brief overview of the functions that I have coded and called them on the OnInit Function
 GetColumnDatatoArray(1,Trend);
 GetColumnDatatoArray(2,dates);
These functions are very common, we have used them on our library a lot, basically we collect data from the first column then we store them to a Trend[] Array the same process for the dates[] Array.
The Next important thing is to convert, the Time that we gathered from a csv file to a standard time format that could be understood in MQL5
ConvertTimeToStandard();
Here is what's inside that function:
void ConvertTimeToStandard()
 {
// A one time attempt to convert the date to yy.mm.dd

    ArrayResize(date_datetime,ArraySize(dates));
    for (int i=0; i<ArraySize(dates); i++)
       {
         StringReplace(dates[i],"/","."); //replace comma with period in each and every date
         //Print(dates[i]);
         string mm_dd_yy[];

         ushort sep = StringGetCharacter(".",0);
         StringSplit(dates[i],sep,mm_dd_yy); //separate month, day and year

         //Print("mm dd yy date format");
         //ArrayPrint(mm_dd_yy);

         string year = mm_dd_yy[2];
         string  day = mm_dd_yy[1];
         string month = mm_dd_yy[0];

         dates[i] = year+"."+month+"."+day; //store to a yy.mm.dd format

         date_datetime[i] = StringToTime(dates[i]); //lastly convert the string datetime to an actual date and time
       }
 }
Those are the functions that I think are worth explaining, what has been done in the Init() Function.
The next thing is to test the model predictions on the Ontick function, here is the pillar of our Expert Advisor:
    datetime today[1];
    int trend_signal = -1; //1 is buy signal 0 is sell signal

    CopyTime(Symbol(),PERIOD_D1,0,1,today);

    if (isNewBar())
     for (int i=0; i<ArraySize(date_datetime); i++)
      {
          if (today[0] == date_datetime[i]) //train in that specific day only
              {

                  if ((int)Trend[i] == 1)
                    trend_signal = 1;
                  else
                     trend_signal = 0;

                  // close all the existing positions since we are coming up with new data signals
                  ClosePosByType(POSITION_TYPE_BUY);
                  ClosePosByType(POSITION_TYPE_SELL);
                  break;
              }

          if (MQLInfoInteger(MQL_TESTER) && today[0] > date_datetime[ArrayMaximum(date_datetime)])
             {
                 Print("we've run out of the testing data, Tester will be cancelled");
                 ExpertRemove();
             }
     }

//--- Time to trade

      MqlTick tick;
      SymbolInfoTick(Symbol(),tick);
      double ask = tick.ask , bid = tick.bid;

//---

      if (trend_signal == 1 && PositionCounter(POSITION_TYPE_BUY)<1)
        {
           m_trade.Buy(Lots,Symbol(),ask,0,0," Buy trade ");
           ClosePosByType(POSITION_TYPE_SELL); //if the model predicts a bullish market close all sell trades if available
        }

      if (trend_signal == 0 && PositionCounter(POSITION_TYPE_SELL)<1)
        {
            m_trade.Sell(Lots,Symbol(),bid,0,0,"Sell trade");
            ClosePosByType(POSITION_TYPE_BUY); //vice versa if the model predicts bear market
        }
  }
The main reason to I chose to train the model on that specific day and at the isNewBar event handle is to reduce the cost of testing our Application, to reduce this cost further I have also hard coded the condition that the Strategy tester should be stopped once we run out of the testing dataset
That's it see the full code linked below, now its time to test the model in the strategy tester
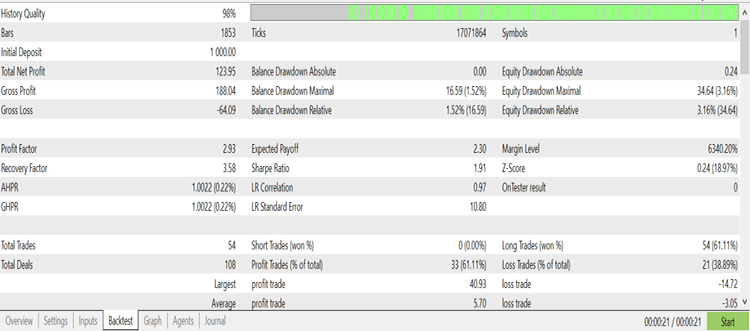
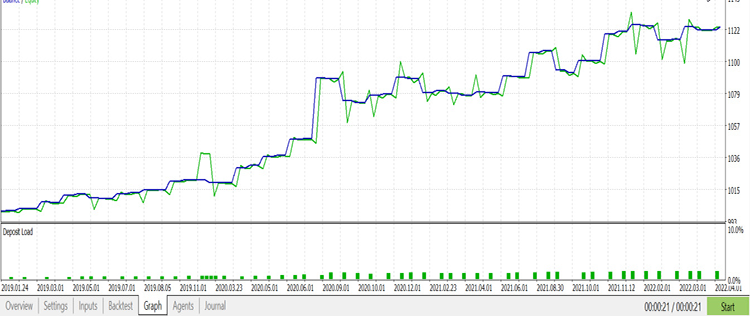
APPLE Testing results
Graph
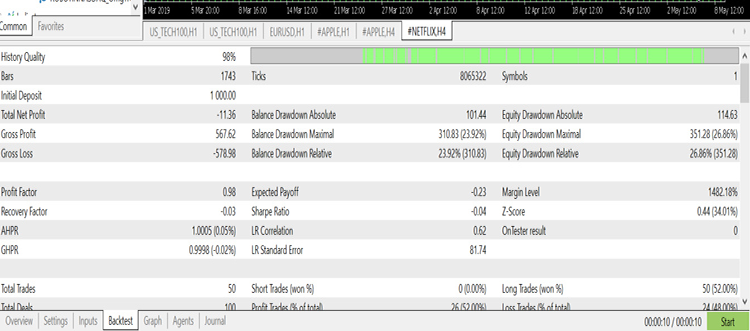
Netflix on the other hand, tester report
Tester Graph
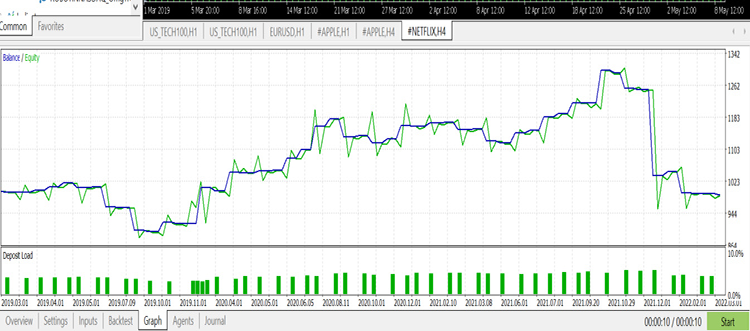
Great, as you can see Apple model had an accuracy of about 70%, and it has made a good predictive model so far with a nice graph on the strategy tester compared to its rival NETFLIX
The bottom Line
The good thing about logistic models is that they are easy to construct and train yet they do a pretty good job at classifying our data, though finding the data to find in our model is something that should not be taken for granted as it is among the most crucial steps that once mistaken could lead to inefficient model.
You can still make more improvements to our library though and recollect the data again because I still believe the way I collected the data and classified them inside Crashclassify script is not an effective way to observe the crash, anyway that's for reading.
Github repository for this Article linked here > https://github.com/MegaJoctan/LogisticRegression-MQL5-and-python.
 Learn how to design a trading system by MFI
 Learn how to design a trading system by Accumulation/Distribution (AD)
 Video: How to setup MetaTrader 5 and MQL5 for simple automated trading
- Free trading apps
- Over 8,000 signals for copying
- Economic news for exploring financial markets
You agree to website policy and terms of use


Very interesting indeed. Did you also consider testing at different/random start dates or simply split the history in equally large intervals?
great question,
A: about choosing the random testing and training datasets, it is possible to do so and it is my goal that after further updates on the library one should be able to do so(python libraries on ML can help you achieve this) still there is a lot to cover on this subject
B: you can read about the classification in all the sectors you've mentioned outside this platform because, I think that's irrelevant in the trading community available in this platform