
Triangle Finder product page
MT4 version here
MT5 version here
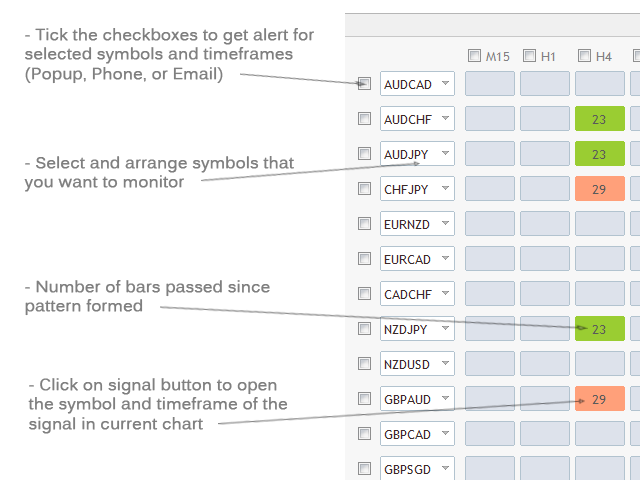
The dashboard
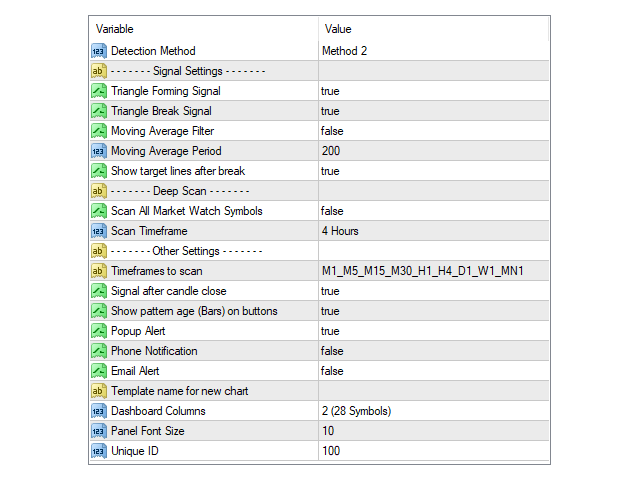
Settings
Detection Method: There are 2 pattern detection methods the first method finds larger patterns and 2nd method finds smaller patterns more suited for short-term trades.
--- Signal Settings ---
Triangle Forming Signal/ Triangle Break Signal: You can choose what signals to show on the dashboard by enabling/disabling these settings. The yellow color is for pattern forming signal. The green color is for Up break and the red color for the down break.
Moving Average Period: Set the MA period here for the moving average filter.
Show target lines after break: If true, the scanner draws suggested targets based on channels.
--- Deep Scan ---
Scan All Market Watch Symbols: Set this to true to start deep scan for all symbols available in MetaTrader market watch window.
Scan Timeframe: Set the timeframe for deep scan.
Note about deep scan:
Since this mode scans all market watch symbols it can be a heavy task. Based on the number of symbols and your system performance it might take about 30 seconds to complete the scan.
You have to reload the indicator every time you want to scan again (clicking on the refresh button in the top right of the dashboard in the MT4 version or changing the timeframe of the chart that the indicator is attached to in the MT5 version also reloads the indicator).
After the opening of the Metatrader, the first time you run the deep scan it might not find all the patterns because the data of all market watch symbols is not downloaded yet. It's a good idea to rescan after a few minutes to be sure about updated data.
--- Other settings ---
Timeframes to scan (MT4 version): You can type the name of timeframes (as shown in the MT4 toolbar) you want to monitor separated with underline(underscore) "_" symbol. Reducing the number of timeframes for monitor reduces the calculations required and improves the dashboard performance.
Signal after candle close: If true dashboard waits until the close of the current candle then checks the signal.
Dashboard Columns: Choose between 1 or 2 columns of symbols (14 or 28 symbols) in the dashboard.
Panel Font Size: You can change the font size of labels and buttons info with this.
Unique ID: If you want to set and save different sets of symbols set a different id number (any number) for each of them. To do that first set the new id in the settings then change the symbols then save the chart as a template. Do not change symbols before changing the id because changes will be saved automatically to the current id number.
Timeframe Settings (MT5 version)
There are up to 9 timeframes for each symbol. For each timeframe you can choose from 21 default MT5 timeframes from dropdown list. By selecting "current" for a timeframe you can disable that timeframe and reduce the number of timeframes in dashboard. Reducing the number of timeframes for monitor reduces the calculations required and improves the dashboard performance.
The first time you run the indicator it might take a while to update history data and show signals.
If you are running the indicator on an older PC there are things that you can do to improve performance:
- Set "Max bars in chart" to 10000 or less in the Charts tab on the MetaTrader options dialog (ctrl+o).
- Reducing the number of timeframes as stated above in timeframe settings also improves performance.
- Reducing the number of symbols.
- Set the "Signal after candle close" option to true.


")