

Trading recommendations
Buy Stop 18215. Stop-Loss 18150. Take-Profit 18290, 18405, 18600, 18620
Sell Stop 18120. Stop-Loss 18190. Take-Profit 18015, 17920, 17885, 17700, 17490, 17380, 17150

Technical analysis
Record growth observed since the beginning of July stopped in mid-August.
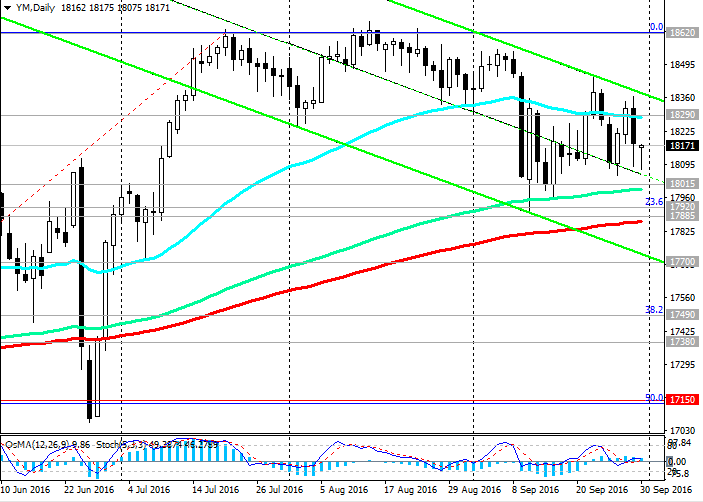
DJIA index after reached new record highs near the mark of 18620 is reduced, and on the daily chart the DJIA formed a new downstream channel with a lower limit, passing near the level of 17700. The index rebounded yesterday from the resistance level of 18290 (EMA50 daily chart, EMA200, EMA144 4- hourly chart).
Indicators OsMA and Stochastic on the 4-hourly chart turned to short positions in the daily and weekly charts - and move on to the seller. At the end of the trading week and month can be observed in the indices closing positions and exit of investors into dollars. In case of further reduction targets will be the nearest support levels 18015 (EMA144 on the daily chart), 17920 (Fibonacci correction level of 23.6% to the growth in the wave with a level of 15660 after the recovery in February this year to the precipitous fall in the markets since the beginning of the year), 17885 (EMA200 on the daily chart). Deeper decline within the descending channel on the daily chart support level is allowed to 17700. A break of support levels of 17,490 (38.2% Fibonacci level EMA144 and the lower line of the rising channel on the weekly chart), 17380 (EMA200 on the weekly chart) can break the upward trend of the index DJIA. Breakdown level of 17150 (50.0% Fibonacci level and EMA200, EMA144 on the monthly chart) confirms the change in trend.
However, the positive dynamics of US indexes is retained. Probably is a repeat of growth to levels near the annual maximum level of 18,600 while the DJIA is above 17885. One moderate increase in interest rates in the United States is not enough to change the bullish trend of the US stock market. The signal for the resumption of growth in the scenario can be broken through the resistance level of 18290.
Support levels: 18015, 17920, 17885, 17700, 17490, 17380, 17150
Resistance Levels: 18290, 18405, 18600, 18620
Overview and Dynamics
US stocks are down a second day against the backdrop of the fall of the banking sector and shares in biotech companies. Following the auction on Thursday, Dow Jones Industrial Average fell 1.1% to 18143 points, S & P500 - on 0,9%, Nasdaq Composite fell by 0.9% under the pressure of falling shares of biotechnology companies. The US Commerce Department on Thursday released the latest estimate of GDP for the 2nd quarter, according to which the economy grew at a faster pace than previously expected. US GDP in the 2nd quarter, adjusted for inflation, rose by 1.4% year on year (against the growth in the last month by 1.1% and the forecast of + 1.3%).
On Wednesday, Fed Chairman Janet Yellen said that although "there is no fixed timing", the rate hike should occur. Once the Fed receives hints at imminent rate hike in the US stock indexes are down immediately.
At present, the probability of increasing interest rate data Fed CME Group December estimated at 56% compared with 53% in the medium. WSJ dollar index rose by 0.3%.
Profit-taking in long positions on oil and decrease in oil prices also contribute to the reduction of global and US indices. Oil prices rose by more than 7% over the past two trading days after OPEC announced its readiness to reduce total production cartel to 32,5-33 million barrels a day in August against the level of 33.2 million barrels a day. The next formal OPEC meeting to be held in Vienna on November 30, the country will agree on the details of the cartel agreement, including individual quotas for each of the OPEC countries.
However, oil futures in Asia on Friday, falling, and oil market participants take profits. Investors do not believe that OPEC will be able to implement the agreement, which they have previously agreed on Wednesday in Algeria. The OPEC countries do not always comply with the quotas.
Manufacturers in the US shale oil can also be activated on the background of a possible reduction in oil production in OPEC and rising prices.
Today at 20:00 (GMT + 3) will be reported Baker Hughes oilfield services company in the United States in the number of active drilling rigs, which is an important indicator of the activity of the oil sector of the US economy. The current value of the index – is 418 active rigs. Increase in the number of drilling a negative impact on oil quotes that will also help build pressure on the oil sector and stock indices.
It is also necessary to take into account that today is the last trading day of the week and month, and investors are likely to want to go into the cache.Author signals - https://www.mql5.com/en/signals/author/edayprofit


")