Technical Analysis of USDX for March 31, 2016
The Dollar index continued its slide towards the previous low of 94.60 and for now it holds above it. As I said yesterday, the price was more likely to move to new lows but we should be looking closely for the possibility of a double bottom formation.
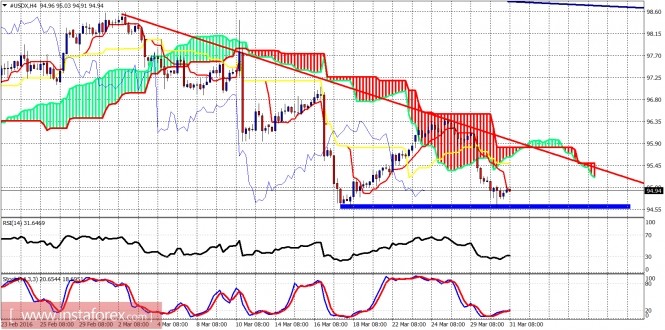
Red line - resistance
Blue area - support
The Dollar index remains in a short-term bearish trend. The price has stopped the decline right at the blue support area of the previous low. A double bottom formation could be in the process here but it is still too early to tell. A bullish reversal signal will come once the price breaks above the red trend line resistance.
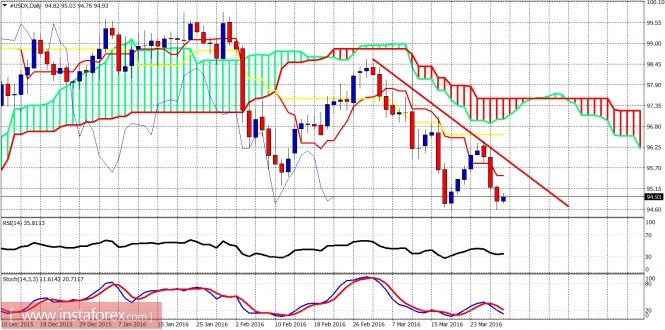
Red line - resistance trend line
On the daily chart, the trend remains bearish but with some bullish divergence signals by the stochastic oscillator. The trend is still bearish but there are signs of a possible bounce at least towards 95.60-95.80. The price remains below the daily Kumo (cloud), so a big reversal signal will be the first to break above the cloud. It is still too early to see something like this. New lows are more probable towards 94-93.70.
The material has been provided by InstaForex Company - www.instaforex.com

