
Technical Analysis for US Dollar, S&P 500, Gold and Crude Oil - Resistance Above $59

US DOLLAR TECHNICAL ANALYSIS
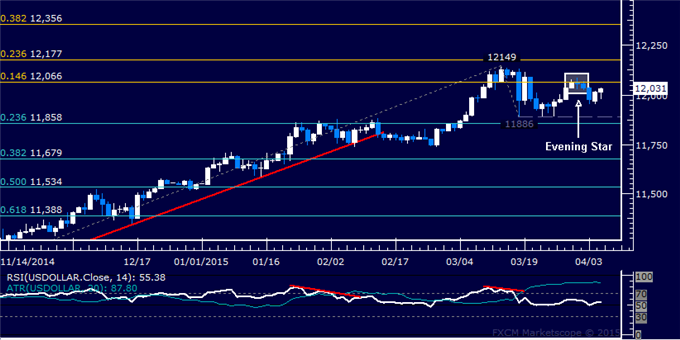
Prices areattempting to launch a
recovery after moving downward as expected. Near-term support is in the
11858-86 area (March 18 low, 23.6% Fibonacci retracement), with a break
below that on a daily closing basis exposing the 38.2% level at 11679.
S&P 500 TECHNICAL ANALYSIS
Prices are consolidating after
moving lower as expected following the appearance of a bearish Evening
Star candlestick pattern. A daily close below the March 12low at 2040.10
exposes the 38.2% Fibonacci retracement at 2004.60.

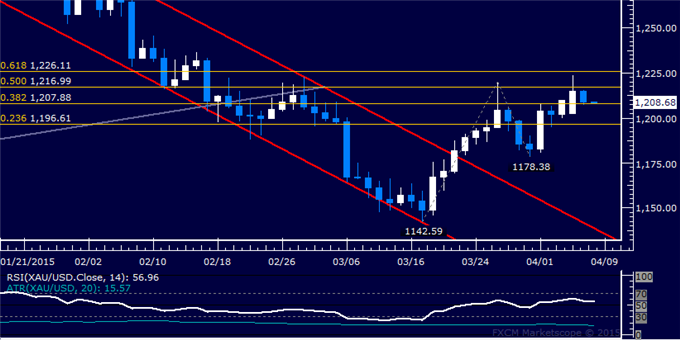
GOLD TECHNICAL ANALYSIS
Prices paused to digest gains after
rising to test the highest level since mid-February. A daily close above
the 50% Fibonacci expansion at 1216.99 exposes the 61.8% level at
1226.11. Alternatively, a reversal below the 38.2% Fib at 1207.88
targets the 23.6% expansion at 1196.61.
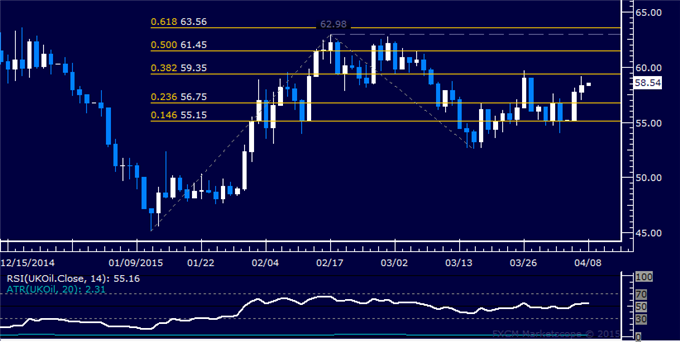
CRUDE OIL TECHNICAL ANALYSIS
Prices are aiming to test
resistance at 59.35, the 38.2% Fibonacci expansion, after pushing above
the 23.6% level at 56.75. A daily close above resistance exposes the 50%
Fib at 61.45. Alternatively, a reversal back below 56.75 targets the
14.6% expansion at 55.15.


")