
EUR/JPY – 131.72
EUR/JPY: Wave v as well as larger degree wave (C) ended at 94.11 and first leg of larger degree wave C upmove has possibly ended at 149.79 and wave 2 correction has commenced for weakness to 128.50-55 first.
The single currency has continued to trade lower after breaking below last week's low at 133.44 and broke below previous support at 132.22, signaling the rebound from 130.15 has ended at 136.69 and bearishness is seen for weakness to 131.00, then retest of 130.15, however, break there is needed to confirm the major fall from 149.79 top has resumed for weakness to psychological support at 130.00 and later towards 128.50-55 (38.2% Fibonacci retracement of 94.11-149.79).
The daily chart is labeled as attached, early selloff from 169.97 (July 2008) to 112.08 is wave (A) of B instead of end of entire wave B and then the rebound from there to 139.26 is wave (B), hence, wave (C) has possibly ended at 94.12 with a diagonal triangle as labeled in the daily chart, hence upside bias is seen for further gain. Recent rally above indicated retracement level at 116.69 (50% Fibonacci retracement of the intermediate fall from 139.26-94.12) adds credence to this view and signal major reversal has commenced but first leg of this wave C has possibly ended at 149.79, hence wave 2 has commenced, break of 134.14 support would justify this view and bring correction to 130.00 and possibly towards 128.50-55.
On the upside, whilst recovery to 132.50-60 cannot be ruled out, reckon upside would be limited to said previous support at 133.44 and bring another decline. Above 133.80-85 would risk test of 134.60 resistance but break there is needed to signal the retreat from 136.69 has ended instead and prolong consolidation above 130.15, bring another bounce to 135.90-00 but reckon said resistance at 136.69 would hold from here, bring another selloff later.
Recommendation: Sell at 133.50 for 131.00 with stop above 134.50
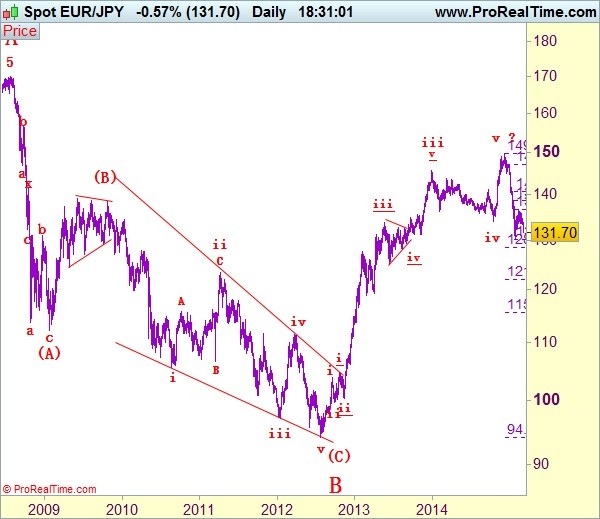
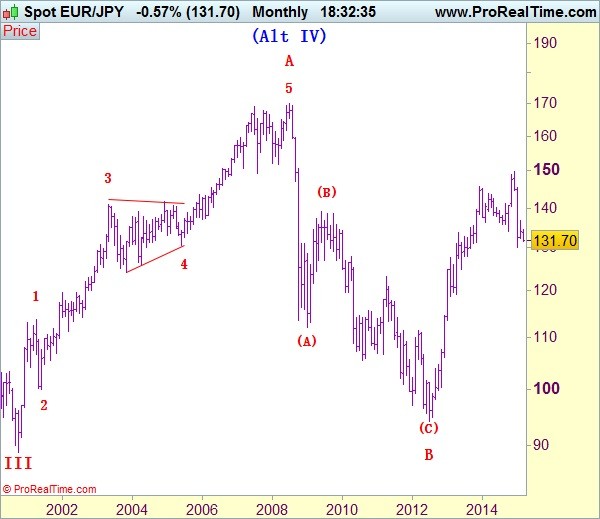
To re-cap the corrective upmove from the record low of 88.93 (18 Oct 2000), the wave A from there is subdivided as: 1:88.93-113.72, 2:99.88 (1 Jun 2001), 3:140.91 (30 May 2003), 4:124.17 (10 Nov 2003) and 5 ended at record high of 169.97 (21 Jul 2008). The brief but sharp selloff to 112.08 is viewed as a-b-c x a-b-c wave (A) of B. The subsequent rebound to 139.26 is (B) of B and (C) of (B) has possibly ended at 94.12 and in any case price should stay well above previous chart support at 88.93, bring rally in larger degree wave C towards 150.00.


")