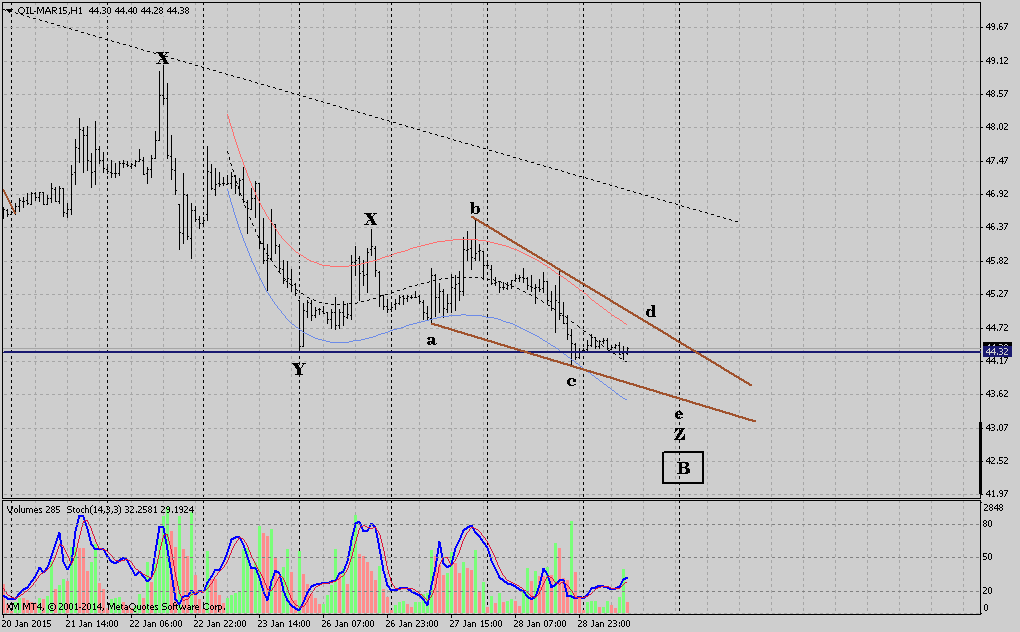
All Blogs / Market News / Crude Oil All Blogs Analytics & ForecastsWeekly TrendsForecastsTrading SystemsMy TradingChartsTrading StrategiesStatisticsTrading IdeasScalpingNeural NetworksWave CountMarket NewsCurrencyMetalsCrude OilCompany NewsEventsBanksBrokersLaw/RegulationsOther Rules Crude Oil Chart pattern Analysis: Crude Oil" Emerging Bullish wedge" 29 January 2015, 10:33 kolioo77 0 75 Crude oil touching the Bottoms forming Bullish wedge expected to complete @ $43 ,Breakout upside will bring higher prices towards $46 to $51 Share it with friends: To add comments, please log in or register The main events by the morning: May 7 Market News 169 0 Oil prices are on the rise due to the situation in the Middle East Crude Oil 147 0 how to trade FOMC Market News 46 0 The main events by the morning: April 16 Market News 114 0 USDCHF 23 JAN 2024 - TRADE WITH THE AMAZING COMBO ITALO LEVELS AND ITALO VOLUME Market News 230 0 CENTRAL BANK OF CHINA RELEASES MEASURES TO STRENGTHEN ECONOMY Market News 169 0 IEA predicts excess oil supply in 2024, even with extension of cuts by OPEC+ Crude Oil 173 0 Euro loses strength against dollar after tougher Fed minutes Currency 173 0 Market Striker EA FAQ how its work Trading Systems 47 0 1 87 Global Gold Analyticals 12.5.2024 215 Vikopo Slow Pattern 308 Volume Analysis (VSA) technical analysis gold eurusd EUR/USD Fed forex forex news GBP/USD usd/jpy ECB Trading crude oil metals Ichimoku China S&P 500 fundamental analysis Mql5 News AUD/USD Mql5 Signals forecast news Mql5 Analysis VistaBrokers stocks usd gbpusd usdjpy bitcoin support


")