
Precision Trading: Introducing Our MT5 Indicators for Optimal Market Insights
Precision Trading: Introducing Our MT5 Indicators for Optimal Market Insights
We have set a premium price for our MT5 indicators, reflecting over two years of development, rigorous backtesting, and diligent bug fixing to ensure optimal functionality. Our confidence in the precision and accuracy of our indicators is such that we regularly showcase them in real-time market conditions through daily content on our social media channels.
Our belief in trading simplicity, adhering to the principle of buying low and selling high (or vice versa), is echoed in our indicators' clear display of potential entry and exit points. We consistently provide daily content demonstrating our indicators in action. Additionally, we offer traders the opportunity to rent our indicators for $66 per month. This allows traders to test the indicator for one month with their chosen trading pair before committing to a yearly subscription.
We are committed to monitoring user feedback closely and making necessary improvements to our indicators should any bugs arise, ensuring that traders have access to the most effective tools for their trading endeavours.
Liquidity Finder - CLICK HERE TO BUY
Compatibility:
Liquidity Finder works with all financial instruments currency pairs, indicies, commodities and cryptocurrencies
The Liquidity Finder pin points liquidity zones in any financial instrument, including currency pairs, cryptocurrencies, commodities and indices. The Liquidity finder shows previous and current liquidity zones, down to the present minute, providing essential information about your chosen trading pair, when conducting chart analysis or initiating trades.
The Liquidity Finder allows you to observe where price consolidates, retraces, resists, or settles within support areas. It pinpoints areas where market participants are likely to react to price movements, providing real-time insights into market dynamics. Additionally, the Liquidity Finder offers a visual representation as the price approaches potential liquidity zones, enabling users to make quick and informed decisions.
One of its standout features is its ability to identify bullish and bearish momentum. The color-coded price levels change dynamically in real-time, visually indicating bullish or bearish momentum, as well as when a price level is neutral.
The Liquidity Finder stores the entire day's activity as a CSV file within an internal folder on MT5, making historical data easily accessible for future analysis. Please refer to our attached YouTube video for valuable insights into the functionality and detailed breakdown of how the Liquidity Finder presents essential information, assisting traders view charts with clarity.
What is liquidity?
Liquidity refers to when traders are actively buying or selling at a particular price level, causing the price to remain relatively stable over a certain period. High liquidity indicates a substantial presence of both buyers and sellers actively participating in currency trading, resulting in narrow bid-ask spreads and stable market prices. On the contrary, low liquidity may lead to broader spreads and heightened price volatility due to a reduced number of market participants.
Key Features
- Review price action for the current week, last week and last month.
- Track price action for the entire month down to the present second.
- Areas of liquidity are represented by a higher numerical value.
- Displays distribution of prices across different levels to identify areas of concentrated trading activity.
- View dynamic price action from M5 time-frame to H4.
- All tally's update on the close of the candle within their respective time frames.
- Dynamic highlighting system indicates the current price position relative to corresponding price levels.
- Dynamic highlighting system also indicates when the price is approaching a liquidity zone.
- Quickly visualize bullish or bearish momentum at different price levels from market open, through colour representation of numerical values.
- Option to choose which tally data to display or conceal, while trading or conducting chart analysis.
- Option to reposition the Liquidity Finder to either the left or right side of the chart.
- Save daily trading activity in a CSV file for future reference or chart analysis.
- Offers an intuitive interface for easy interpretation and analysis of incoming data.
- Visual representation of price movement such as spikes, divergences or trends.
- Can be used in conjunction with other technical indicators for comprehensive market analysis.
- Enables users to analyze historical price action to identify past areas of liquidity and trends for chart analysis.
- Allows users to personalize settings such as font colour, session selection, and time periods.
Numeric Value Colour Indication
- Blue Numerical Values - Bullish Momentum: Indicates a surplus of buyers and shortage of sellers, pushing the price up from the corresponding price level
- Red Numerical Values - Bearish Momentum: Indicates a surplus of sellers and shortage of buyers, pushing the price down from the corresponding price level
- Black Numerics - Neutral Momentum: Indicates an equal amount of buyers and sellers at the corresponding price level
Note: Any trading decision made should be based on independent analysis and a thorough understanding of fundamentals, rather than solely relying on tally counts or the colour of numerical values.
Tally Time-Frames
- Tally M5: A higher numeric value indicates greater liquidity at a specific price level, while a lower numeric value suggests limited or no liquidity, allowing the price to move through this level easily without encountering significant resistance from buyers or sellers. The colour of the numerical value signifies the number of buyers or sellers present at that price level. This information typically updates at the close of each 5-minute candle.
- Tally M15: A higher numeric value indicates greater liquidity at a specific price level, while a lower numeric value suggests limited or no liquidity, allowing the price to move through this level easily without encountering significant resistance from buyers or sellers. The colour of the numerical value signifies the number of buyers or sellers present at that price level. This information typically updates at the close of each 15-minute candle.
- Tally M30: A higher numeric value indicates greater liquidity at a specific price level, while a lower numeric value suggests limited or no liquidity, allowing the price to move through this level easily without encountering significant resistance from buyers or sellers. The colour of the numerical value signifies the number of buyers or sellers present at that price level. This information typically updates at the close of each 30-minute candle.
- Tally H1: A higher numeric value indicates greater liquidity at a specific price level, while a lower numeric value suggests limited or no liquidity, allowing the price to move through this level easily without encountering significant resistance from buyers or sellers. The colour of the numerical value signifies the number of buyers or sellers present at that price level. This information typically updates at the close of each 1-hour candle.
- Tally H4: A higher numeric value indicates greater liquidity at a specific price level, while a lower numeric value suggests limited or no liquidity, allowing the price to move through this level easily without encountering significant resistance from buyers or sellers. The colour of the numerical value signifies the number of buyers or sellers present at that price level. This information typically updates at the close of each 4-hour candle.
Extras
- Save CSV: Save entire day's activity as a CSV file within an internal folder on MT5
*The attached GIF file showcases a 2.5-hour video of the Liquidity Finder in action, condensed into a few seconds.
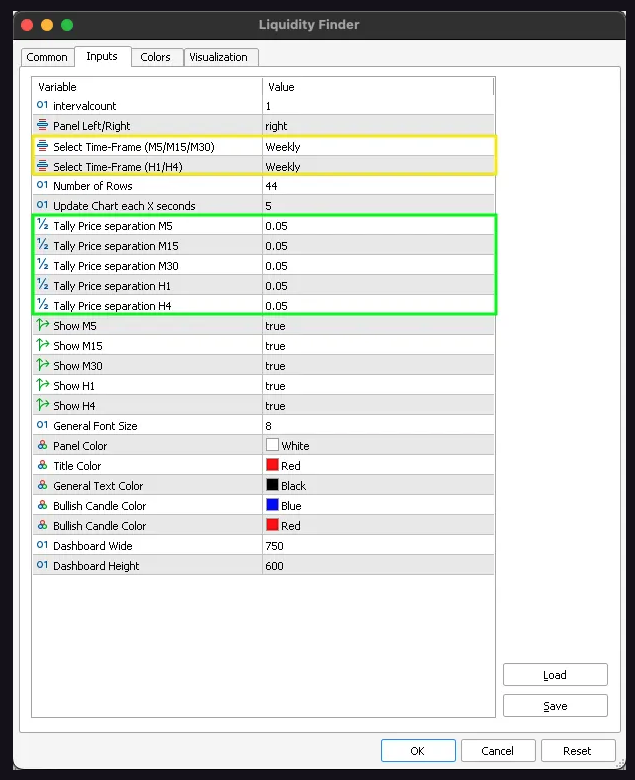
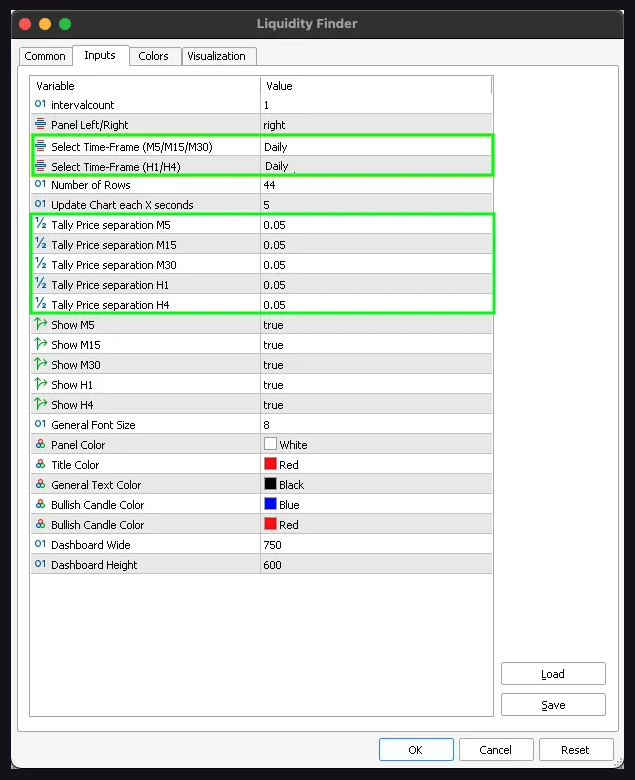
Liquidity Finder Settings
Interval count: Specify the number of periods you wish to view, which depends on the selected Time-Frame, Example: 1 day, 2 days, 3 days, 1 week, 2 week, etc.
Panel left/right: You can choose to position the indicator either to the left or right side of the chart.
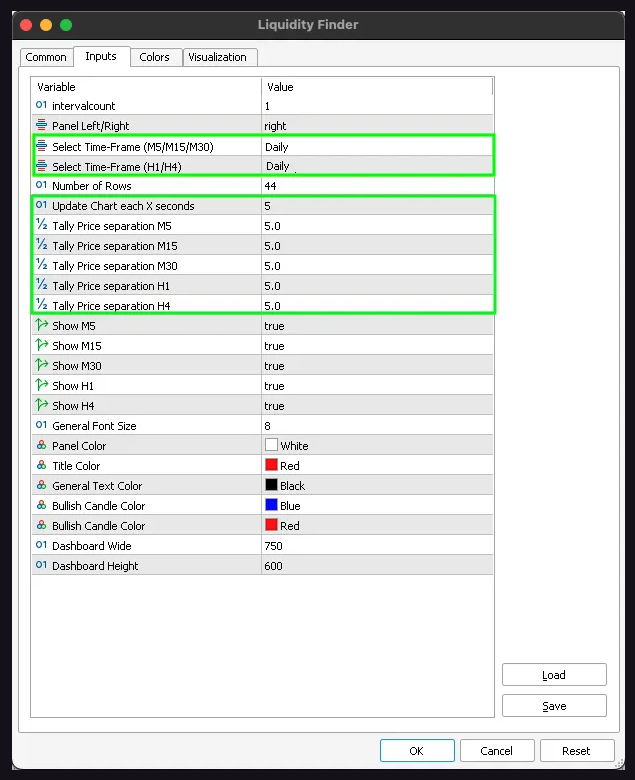
Update chart each X seconds: The default setting for chart updates is configured to refresh every 5 seconds. This interval dictates how frequently the dashboard reveals new data. You can choose to decrease the update interval to 1 second for real-time updates.
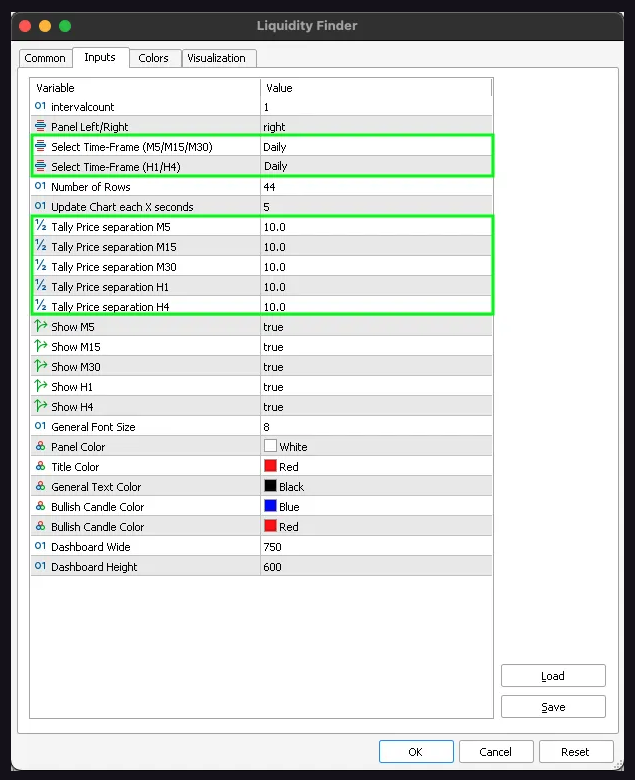
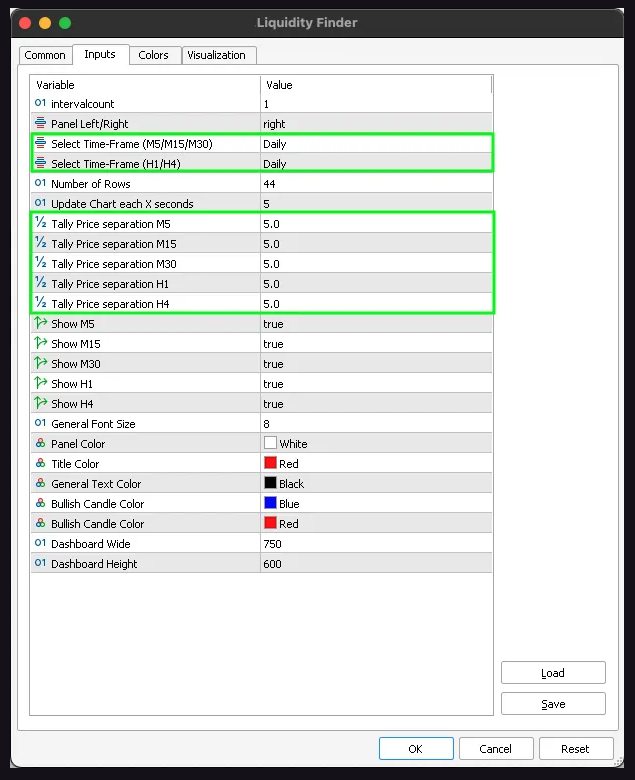
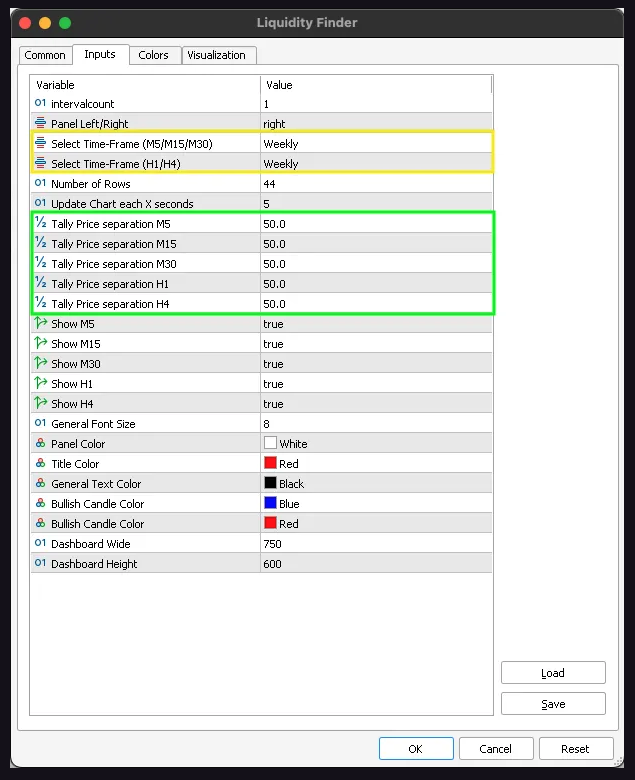
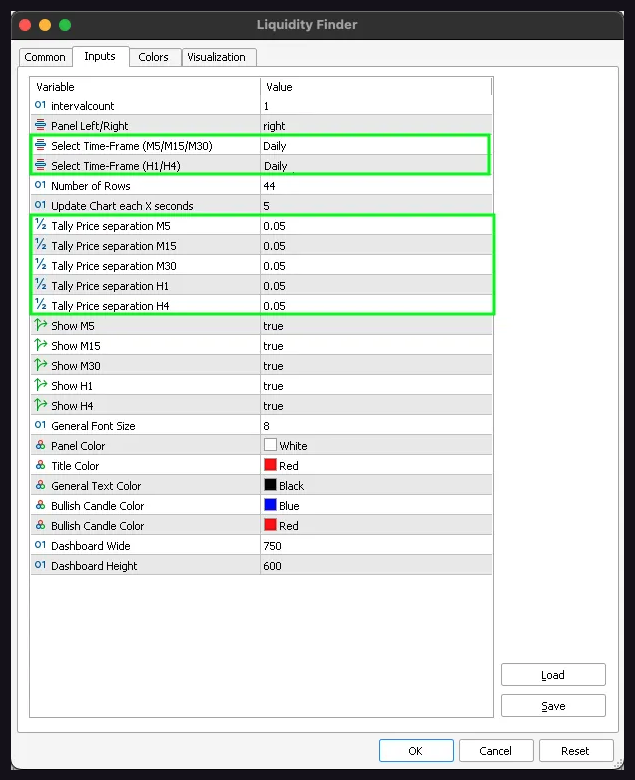
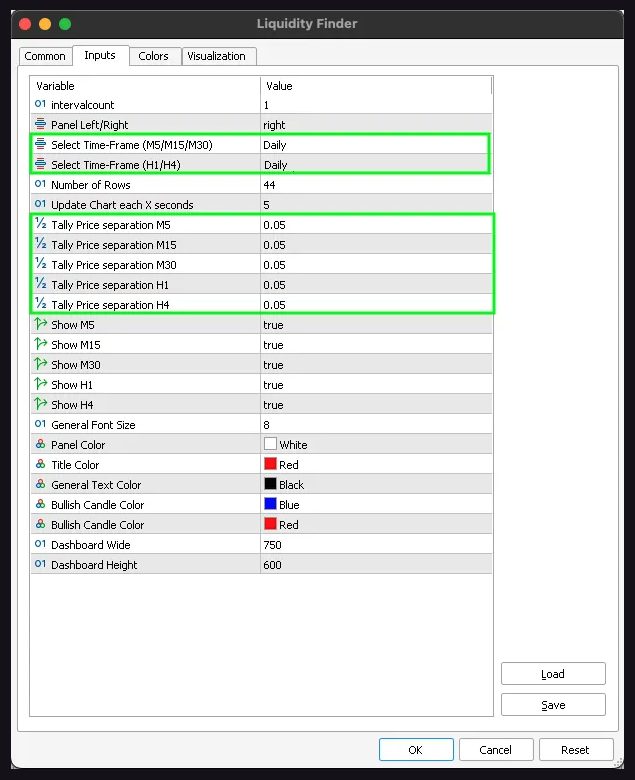
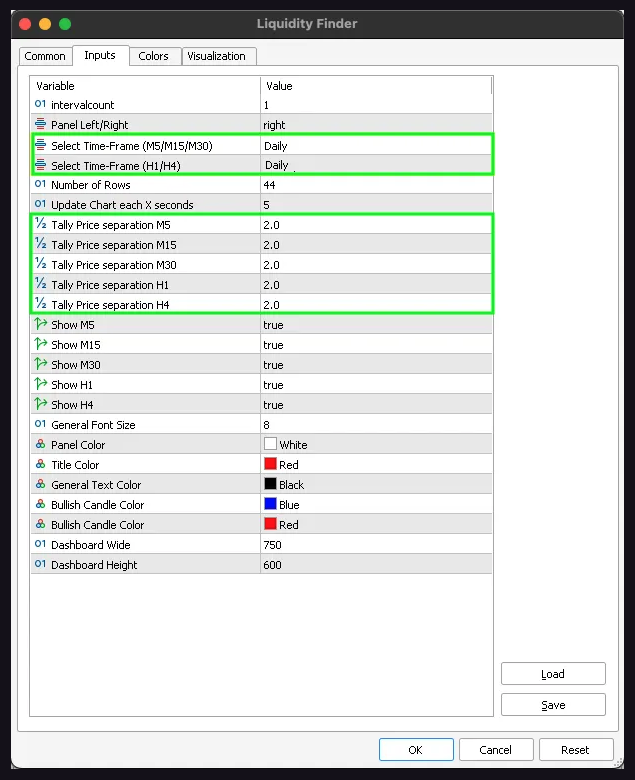
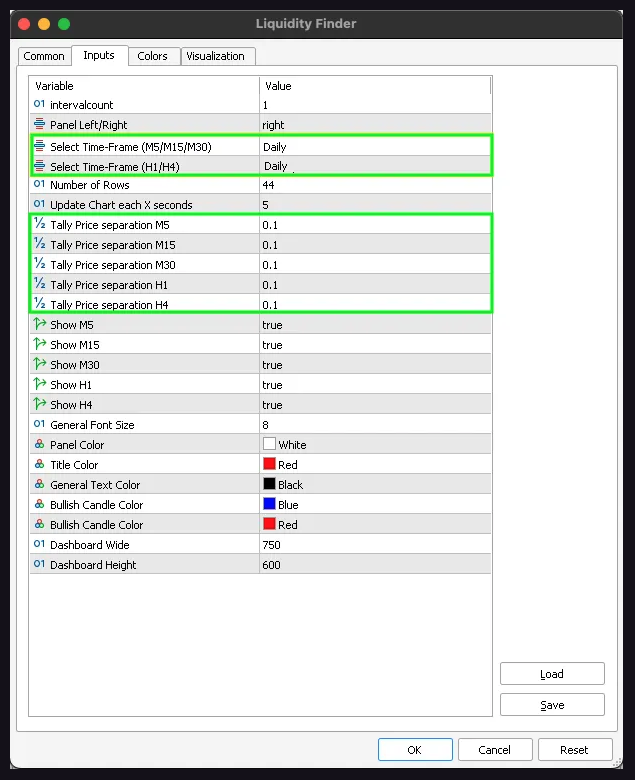
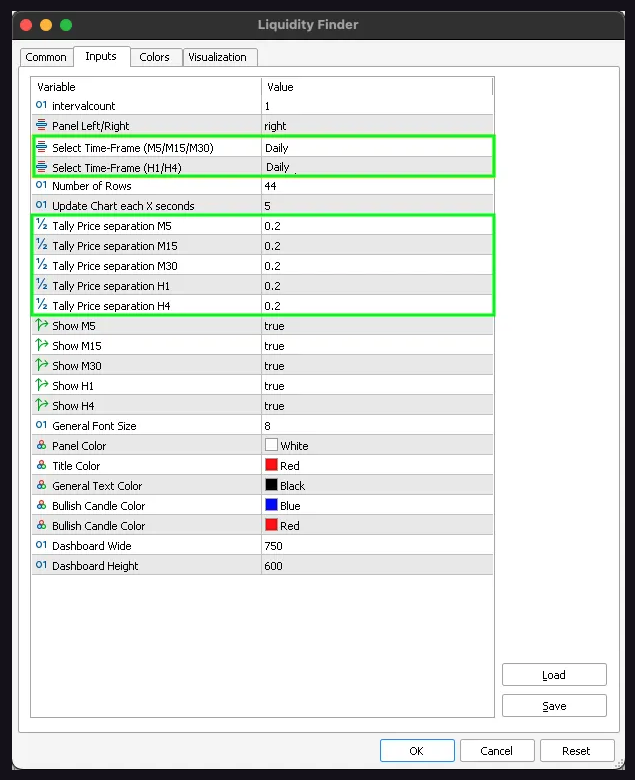
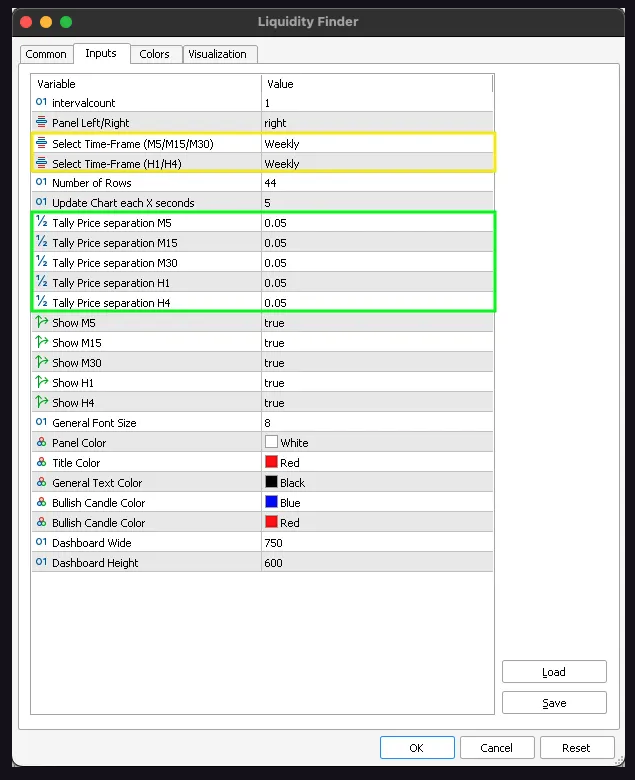
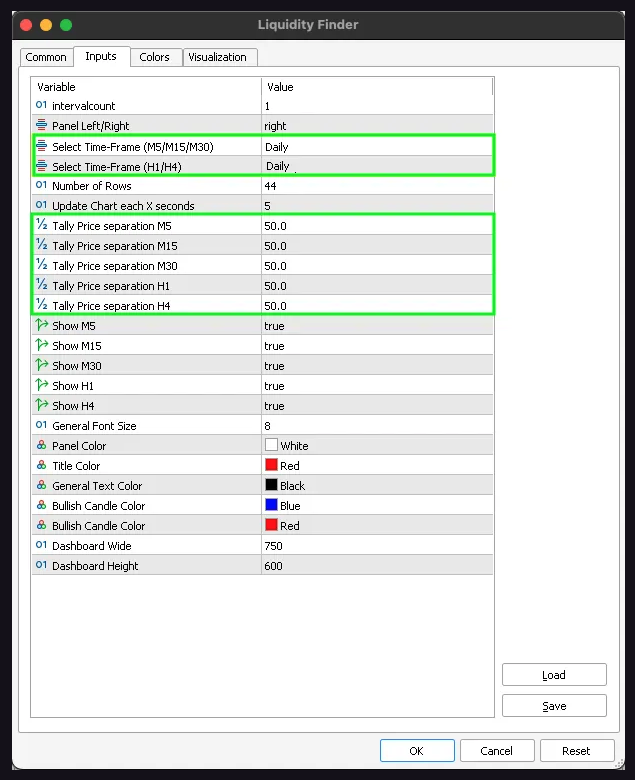
Tally price separation - M5, M15, M30, H1 & H4: These parameter represents the distance between prices, indicating the price levels with the greatest liquidity. We have conducted back testing on the majority of trading pairs, and below are the recommended settings for optimal results across most pairs.
Show - M5, M15, M30, H1 & H4: You have the option to choose which time frame you want to display while trading or conducting chart analysis. Setting it to "true" will show the selected time frame, while setting it to "false" will hide the selected time frame.
Dashboard wide: You have the option to modify the width of the liquidity finder, if you find the default setting obstructs visual representation of the market data. Increasing the width from 750 to 800 often resolves the issue.
Dashboard height: You have the option to modify the height of the liquidity finder, if you find the default setting obstructs visual representation of the market data. Increasing the height from 600 to 800 often resolves the issue.
Other settings: You can keep the remaining settings as default, they will not affect the indicator's performance or visual representation of the market data.
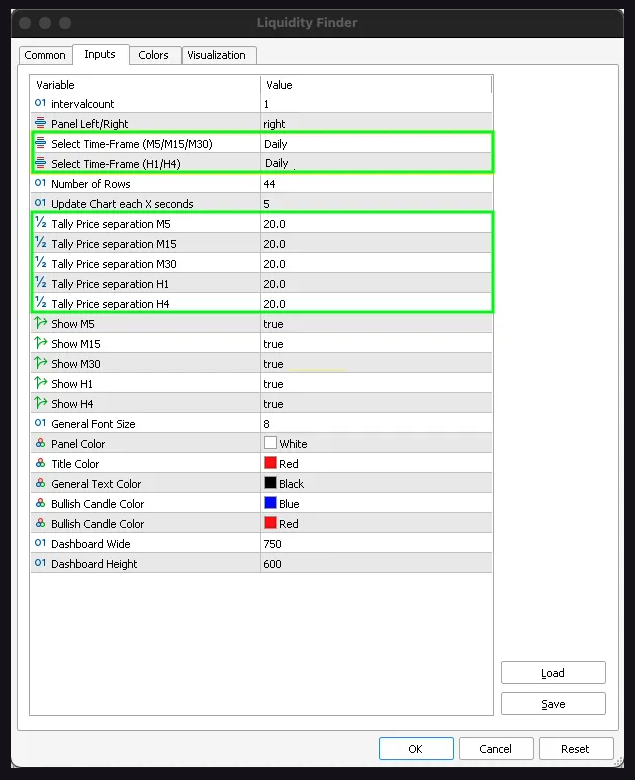
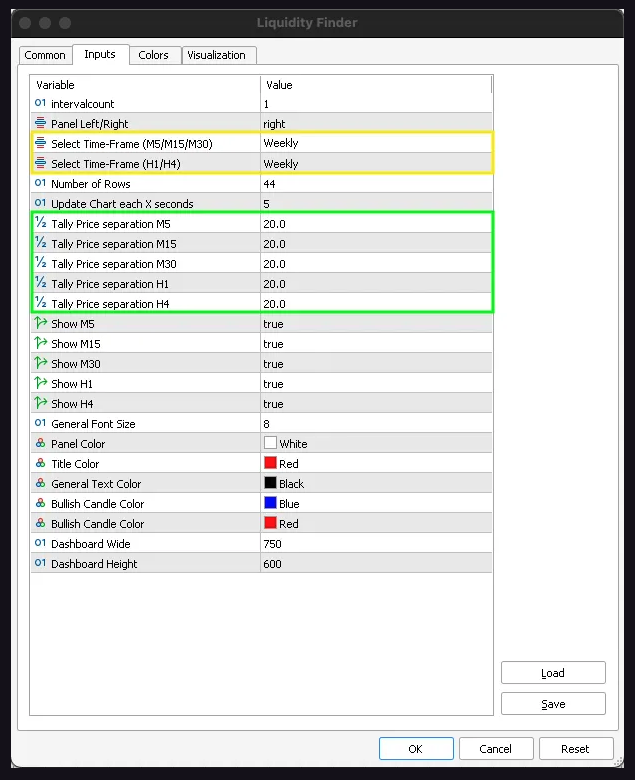
Chart Analysis: Conduct weekly chart analysis by adjusting the time frames of M5, M15, M30, H1, and H4 to display weekly data, with the interval count set to 1. This will help identify areas of support, resistance, and liquidity for the present week.
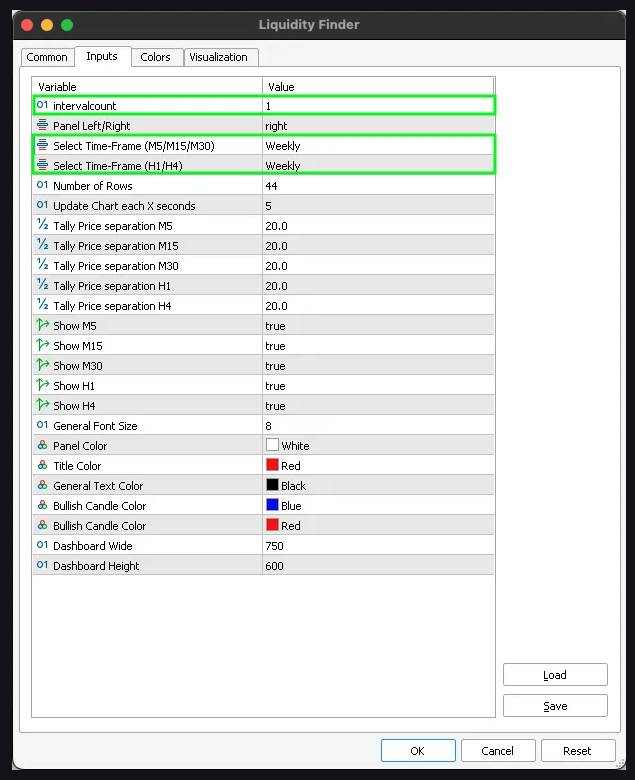
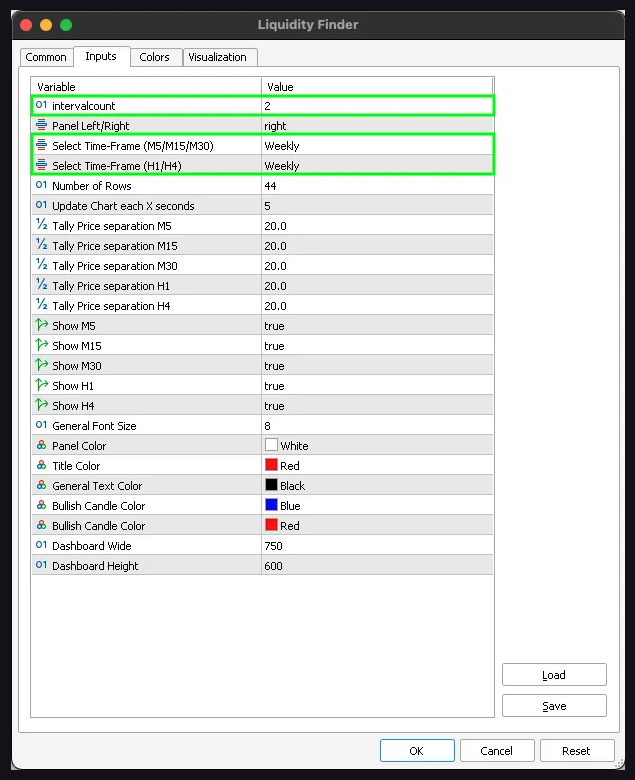
Chart Analysis: You can also adjust the time frames of M5, M15, M30, H1, and H4 to display weekly data, with the interval count set to 2. This will help identify areas of support, resistance, and liquidity for the present & previous week.
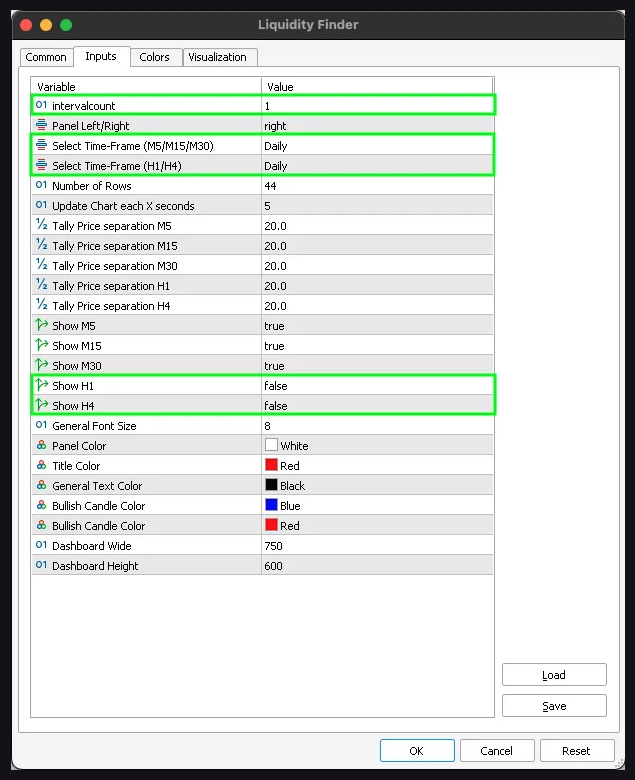
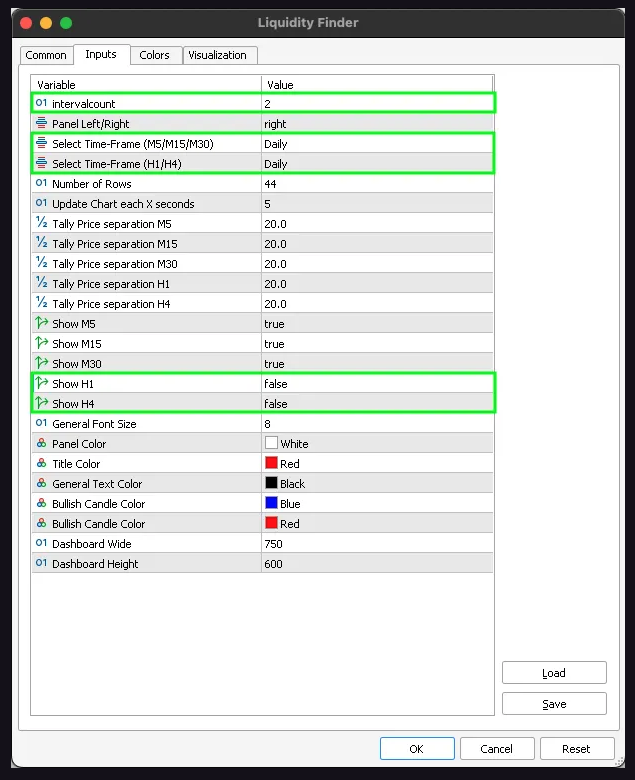
Day Trading Settings: Adjust the time frames of M5, M15, and M30 to display Daily data, with the interval count set to 1. Disable the display of H1 and H4 time frames. This configuration will show the support, resistance, and liquidity levels for the present day.
Day Trading Settings: Adjust the time frames of M5, M15, and M30 to display Daily data, H1 and H4 to display weekly data with the interval count set to 1. Disable the display of H4 time frame. This configuration will show the support, resistance, and liquidity levels for both the present day and the present week on the H1 time frame.

Day Trading Settings: Adjust the time frames of M5, M15, and M30 to display Daily data, with the interval count set to 2. Disable the display of H1 and H4 time frames. This configuration will show the support, resistance, and liquidity levels for the present and previous day.
Indicies
Tally Price Separation: 20.0 (Daily & Weekly)
-
US30
-
NDX100
-
HK50
Tally Price Separation: 10.0 (Daily)
-
GER30
Tally Price Separation: 20.0 (Weekly)
-
GER30

Tally Price Separation: 5.0 (Daily)
-
UK100
-
FRA40
-
ASX200
Tally Price Separation: 10.0 (Weekly)
-
UK100
-
FRA40
-
ASX200

Tally Price Separation: 25.0 (Daily)
-
JPN225

Tally Price Separation: 50.0 (Weekly)
-
JPN225
Tally Price Separation: 2.5 (Daily)
-
EURO STOXX 50
-
SPX500

Tally Price Separation: 5.0 (Weekly)
-
EURO STOXX 50
-
SPX500

CURRENCIES
Tally Price Separation: 0.0002 (Daily)
-
EUR/USD
-
GBP/USD
-
CHF/USD
-
AUD/USD
-
USD/CAD
-
NZD/USD

Tally Price Separation: 0.0005 (Weekly)
-
EUR/USD
-
GBP/USD
-
CHF/USD
-
AUD/USD
-
USD/CAD
-
NZD/USD

Tally Price Separation: 0.05 (Daily)
-
USD/JPY
Tally Price Separation: 0.1 (Weekly)
-
USD/JPY

Tally Price Separation: 0.05 (Daily & Weekly)
-
CHF/JPY
COMMODITIES
Tally Price Separation: 2.0 (Daily & Weekly)
-
XAUUSD
-
XPDUSD
-
XPTUSD

Tally Price Separation: 0.1 (Daily)
-
USOIL
Tally Price Separation: 0.2 (Weekly)
-
USOIL

Tally Price Separation: 0.2 (Daily & Weekly)
-
UKOIL

Tally Price Separation: 0.05 (Daily & Weekly)
-
XAGUSD
CRYPTO CURRENCIES
Tally Price Separation: 50.0 (Daily)
-
BTC/USD
Tally Price Separation: 100.0 (Weekly)
-
BTC/USD

Tally Price Separation: 5.0 (Daily & Weekly)
-
ETH/USD

Tally Price Separation: 0.002 (Daily)
-
XRP/USD

Tally Price Separation: 0.005 (Weekly)
-
XRP/USD


