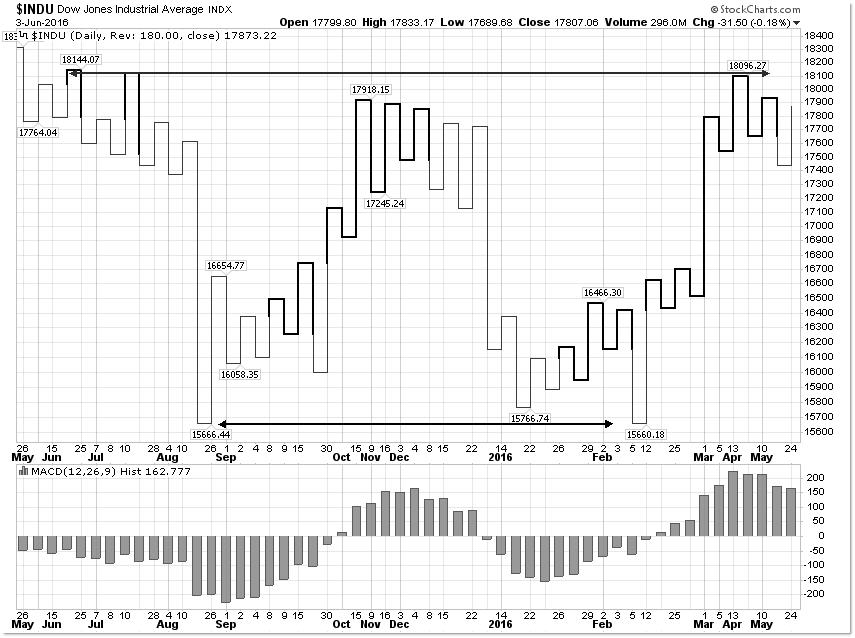
All Blogs / Analytics & Forecasts All Blogs Analytics & ForecastsWeekly TrendsForecastsTrading SystemsMy TradingChartsTrading StrategiesStatisticsTrading IdeasScalpingNeural NetworksWave CountMarket NewsCurrencyMetalsCrude OilCompany NewsEventsBanksBrokersLaw/RegulationsOther Rules Analytics & Forecasts Kagi chart & Dow Jones Industrial 5 June 2016, 22:04 Muhammad Elbermawi 0 126 Dow Jones Industrial Kagi Chart 1% shows support around 15660 & resistance around 18100.Forecasts is down trend to target 15000 before December 2016. To add comments, please log in or register Astra Analytics & Forecasts 44 0 Gold m1 signals Asian market 2024.05.21 Trading Strategies 3 0 Secret Trade Management Tactics Analytics & Forecasts 29 0 1 Wall Street Week: Key Events and Forecasts for the Days Ahead Forecasts 40 0 Way To Stars INTRODUCTION Trading Strategies 50 0 2 🔥🔥🔥🔥EA Trades 20.5.2024🔥🔥🔥🔥 Trading Systems 37 0 Expert Advisor passes Prop Challenge in 5 days Trading Ideas 46 0 Deeyana Angelo on Topstep TV Analytics & Forecasts 38 0 Global Gold Analyticals 19.5.2024 Analytics & Forecasts 78 0 2 78 Global Gold Analyticals 19.5.2024 29 Secret Trade Management Tactics 46 Expert Advisor passes Prop Challenge in 5 days technical analysis gold eurusd EUR/USD Fed forex forex news GBP/USD usd/jpy ECB Trading crude oil metals Ichimoku China S&P 500 fundamental analysis Mql5 News AUD/USD Mql5 Signals forecast news Mql5 Analysis VistaBrokers stocks usd gbpusd usdjpy bitcoin support