USD/JPY: At the 18-Month Lows Again
Review and dynamics
The forecast we provided in the previous review turns out to be correct (if investors feel disappointed with the Bank of Japan’s decision and comments by the US Fed this week, the pair will continue to decline to the recent lows of 108.00).
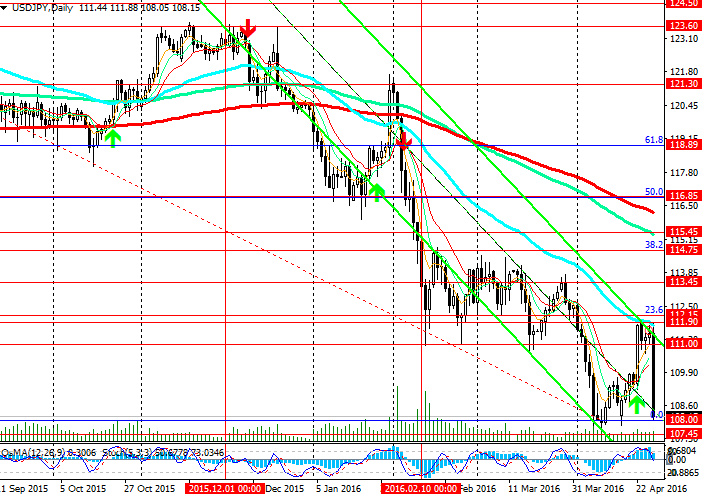
Following the decision of the Bank of Japan to leave monetary policy unchanged, the pair USD/JPY fell by 2.6%, losing over 300 points. Since opening of European session the pair continues to decline. The pair has closely approached the lows of April at the level of 108.00 (ЕМА200 on the weekly chart). Volatility in the pair is 380 points.
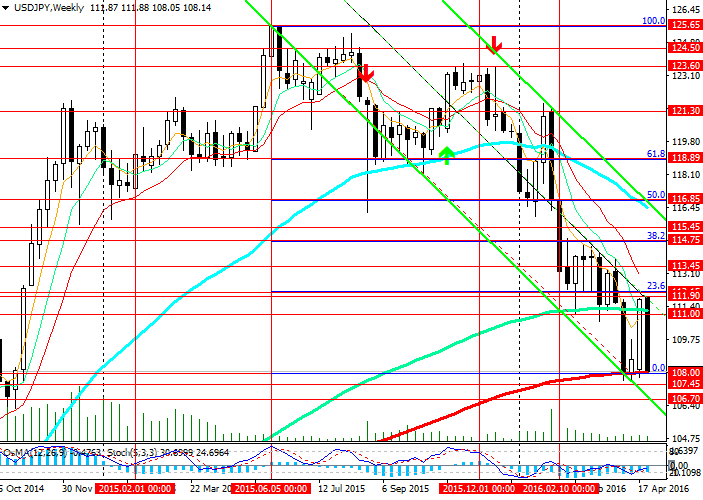
Since mid-April the pair has again reached the level of 111.95, which is crossed by ЕМА50 (on the daily chart). Slightly above the level of 112.15 there is Fibonacci retracement of 23.6% to the decline in the pair since June 2015 from the level of 125.65. In the past three months the pair fell by over 1300 points from the level of 121.30 to the record lows at the level of 108.00.
In the result, the decline in the pair today has balanced out the rise in the pair last week.
Our opinion:
On 4-hour, daily, weekly and monthly charts the indicators OsMA and Stochastic are in favour of the sellers. The pair is declining in the descending channel on the weekly chart with the lower limit at the level of 106.70. However, strong support levels of 108.00 and 107.45 (ЕМА50 on the monthly chart графике) prevent further decline in the pair.
It is possible that the price will rebound from the support zone near these levels. In this case, before opening buy positions, it is advisable to wait for the reversal of the indicators OsMA and Stochastic on the hourly and 4-hour charts.
In case of the rise in the pair the targets will be the levels of 111.00 (ЕМА200 on 4-hour chart) and ЕМА144 (on the weekly chart), 111.90 (ЕМА50 on the daily chart), 112.15 (Fibonacci 23.6%), 114.75 (Fibonacci 38.2%), 115.45 (ЕМА144 on the daily chart), 116.85 (Fibonacci 50%).
Support levels: 111.00, 109.50 and 108.00.
Resistance levels: 111.95, 112.15, 113.45, 114.75 and 115.45.
Trading tips
Sell Stop: 107.80. Stop Loss: 108.10. Take-Profit: 107.45, 107.00, 106.70 and 104.50.
Buy Stop: 108.70. Stop Loss: 107.90. Take-Profit: 109.30, 110.00, 110.50, 111.00, 111.90, 112.15, 113.45, 114.75 and 115.45.

Indicators OsMA and Stochastic are in favour of the sellers

The pair has closely approached the lows of this April at the level of 108.00


