
USD/CAD Intra-Day Technical Analysis - possible bearish breakdown for key support to be crossed
18 September 2015, 11:12

0
960
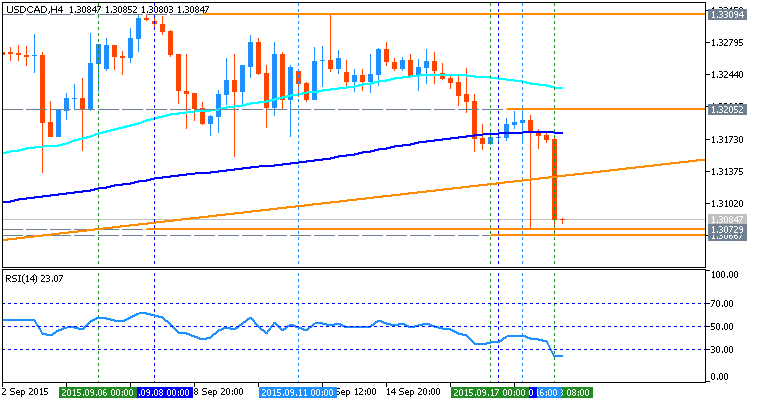
H4 price
is located below SMA with period 100 (100-SMA) and below SMA with the period
200 (200-SMA): the price broke 200-SMA from above to below on close H4 bar and stopped near 1.3068 key support level. RSI indicator is estimating the oversold condition, or possible breakdown of support levels based on fundamental news events for example.
- If the price will break 1.3205 intermediate resistance level so we may see bullish trend to be started with the secondary ranging.
- If the price will break 1.3309 reversal resistance level so the price will be fully reversed to the bullish trend with good breakout possibility.
- if price will break 1.3068 reversal support level so the bearish trend will be continuing.
- if not so the price will be ranging within the levels.
| Resistance | Support |
|---|---|
| 1.3205 | 1.3068 |
| 1.3309 | N/A |
- Recommendation to go short: watch the price to break 1.3068 support level for possible sell trade
- Recommendation to go long: watch the price to break 1.3309 resistance level for possible buy trade
- Trading Summary: ranging
SUMMARY : ranging


