Chance Bullish For Gold in Upper MA 50-100-200 in Graph 4 Hours
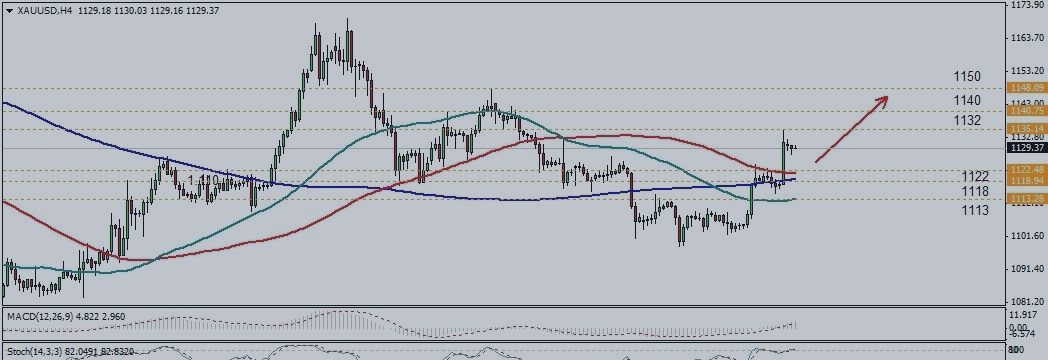
Chance Bullish For Gold in Upper MA 50-100-200 in Graph 4 Hours - Bias potentially bearish for gold prices in the short term because the Stochastic indicator in the 4 hours chart are in overbought area. However, as long as the price moves above the MA 50-100-200 bullish bias is still maintained to this day.
For the bottom side, the nearest support level seen in the area in 1122, through to the bottom of the zone rates will likely move the neutral line is no clear guidance in the short term to test the next support area in 1118 before aiming to key support area in 1113. To the upside, 1132 area is the nearest resistance levels, breaking through to the top of the region the price likely to continue testing the bullish movement to the nearest resistance area in 1140 before retesting to strong resistance area at 1150.
Resistance levels: 1132, 1140, 1150
Level of support: 1122, 1118, 1113


