|
7+ 年
经验
|
0
产品
|
0
演示版
|
|
0
工作
|
0
信号
|
0
订阅者
|
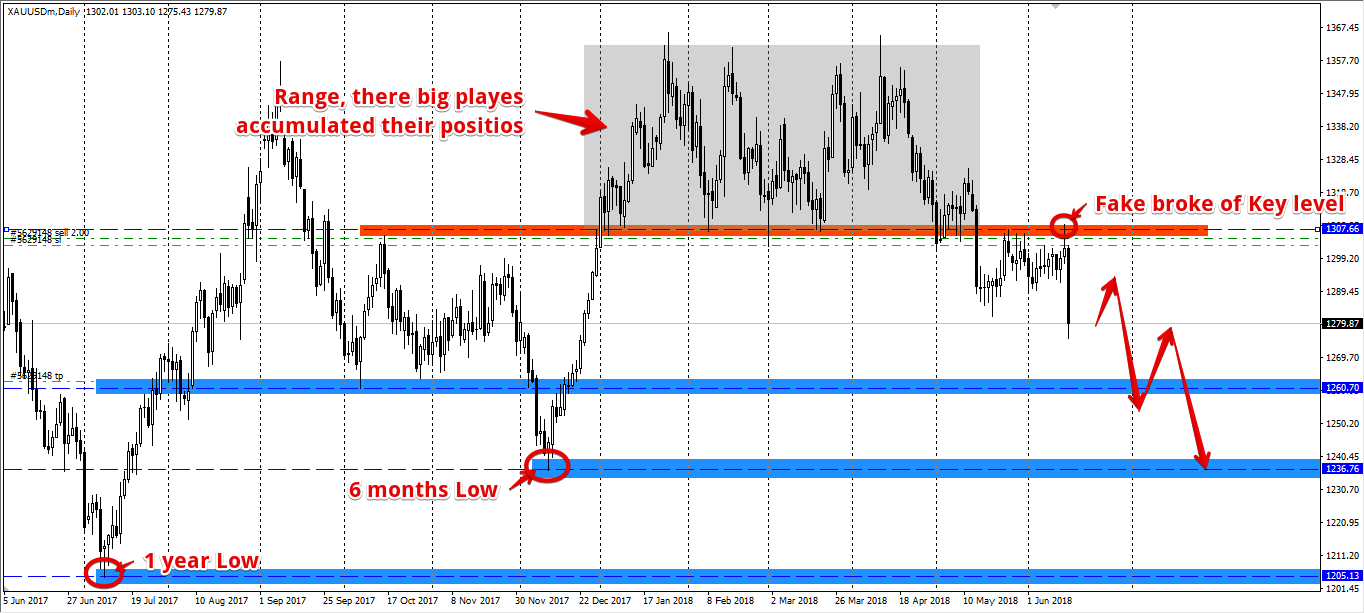
Hello dear frends!
My name is Yuriy, i am in trading since 2013.
Here is some rules of my system:
1. I trade exclusively on my own strategy.
2. I don't use indicators, advisers and assistants, robots, news and other all sorts of rumors and delusions.
3. The maximum acceptable drawdown is 15%.
4. I always set a Take profit and Stop Loss.
5. Trade careful and conservative. Risk per deal less then 1%.
🔥🔥 Generate consistent profits with Biko alerts
GET ACCESS NOW 👉 http://bit.ly/bikoalerts
You will get:
✅ Accurate Intraday and Swing signals (Forex Or Crypto Market)
✅ Proper Stop-Loss, Take-Profit
✅ Lot sizes per entry
✅ Entry/Exit points
✅ Brokers/Exchange recommendations.
✅ Support.
✅ Video trading plans every morning (Mon - Fri)
Take 1 year package — get access to educational course for free.
Don't waste your time as the offer is available for 3 days only!
Also, additional bonus for those who will take 1 year. ATR indicator for free.
Join Now 👉 http://bit.ly/bikoalerts

Yuriy Bishko

Nazim Hussain
2018.06.26
If you've a strategy that really work, you should start a paid signal here at MQL5, so people can see you're a real trade with a track record. How you manage drawdowns, risks and if profitable at the end. This is how the things work in transparent way. Atleast the people who visit MQL are not that fool that they will pay 100$/month for buy/sell signals.