• 信息
6+ 年
经验
32
产品
134
演示版
0
工作
0
信号
0
订阅者
👑 理论物理学家,程序员,交易员,拥有15年的经验。
-------------------------------------------------------------
💰 生產的產品:
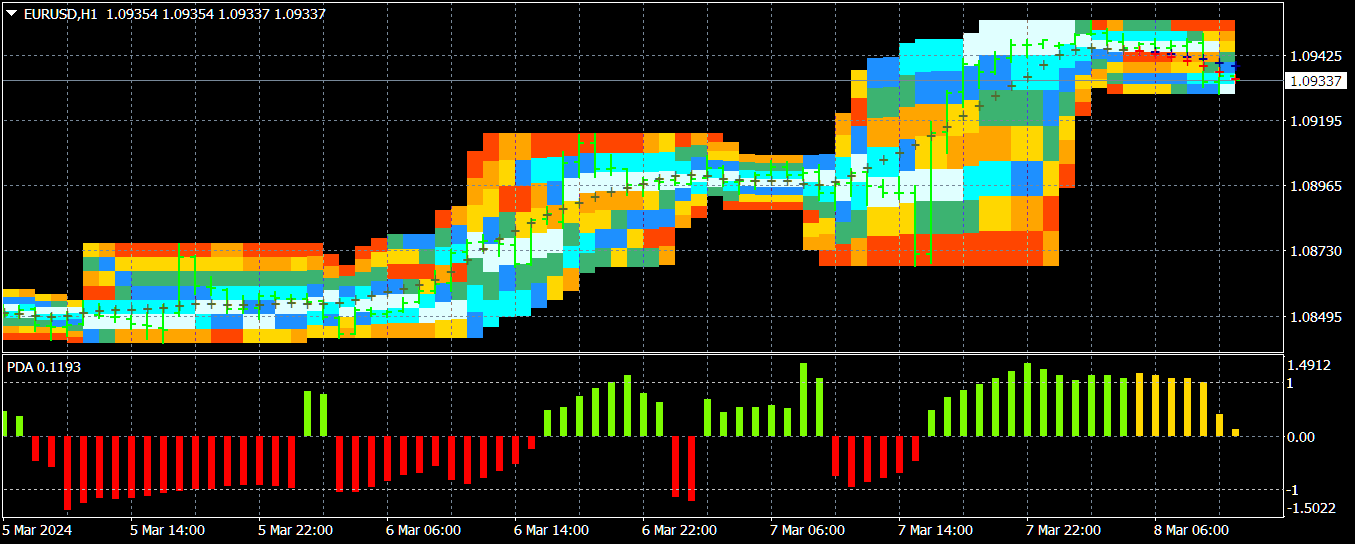
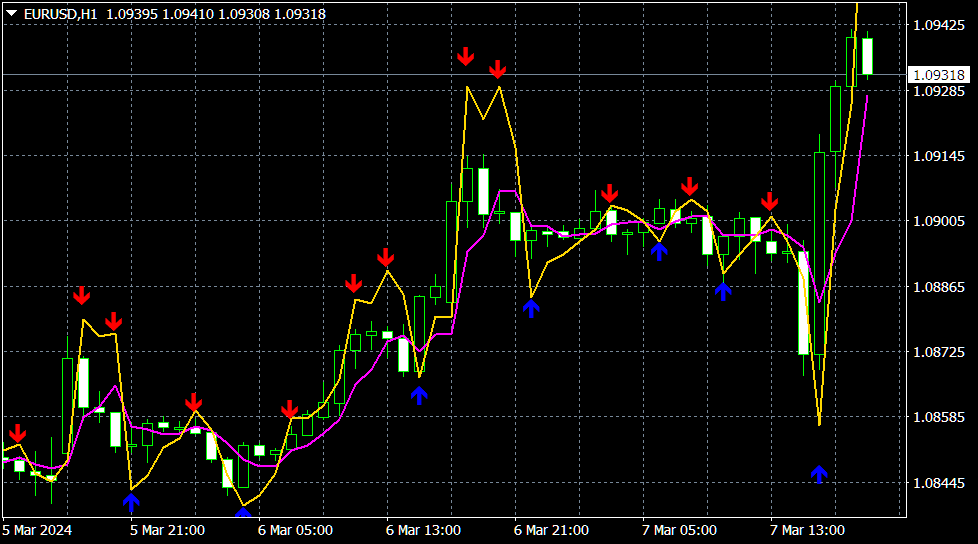
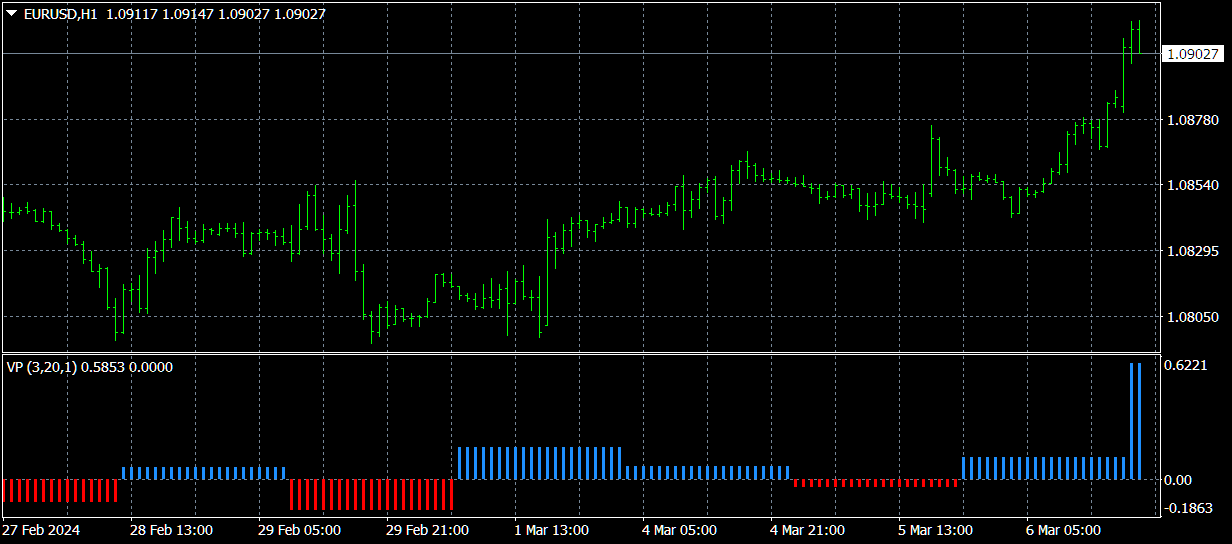
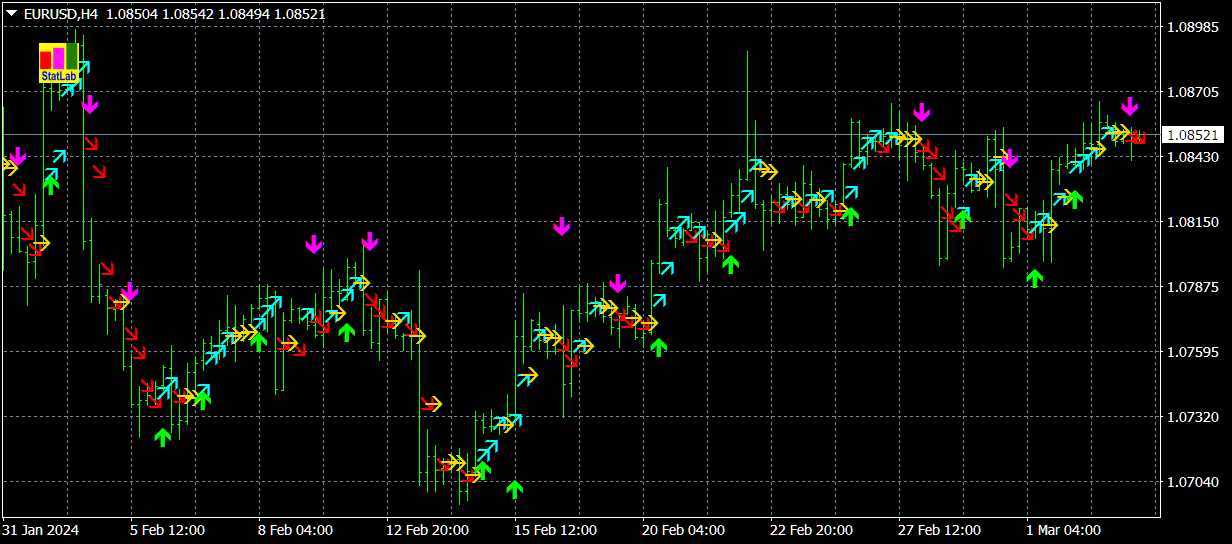
1) 🏆 具有对市场噪音进行最佳过滤的指标(用于选择开仓和平仓点)。
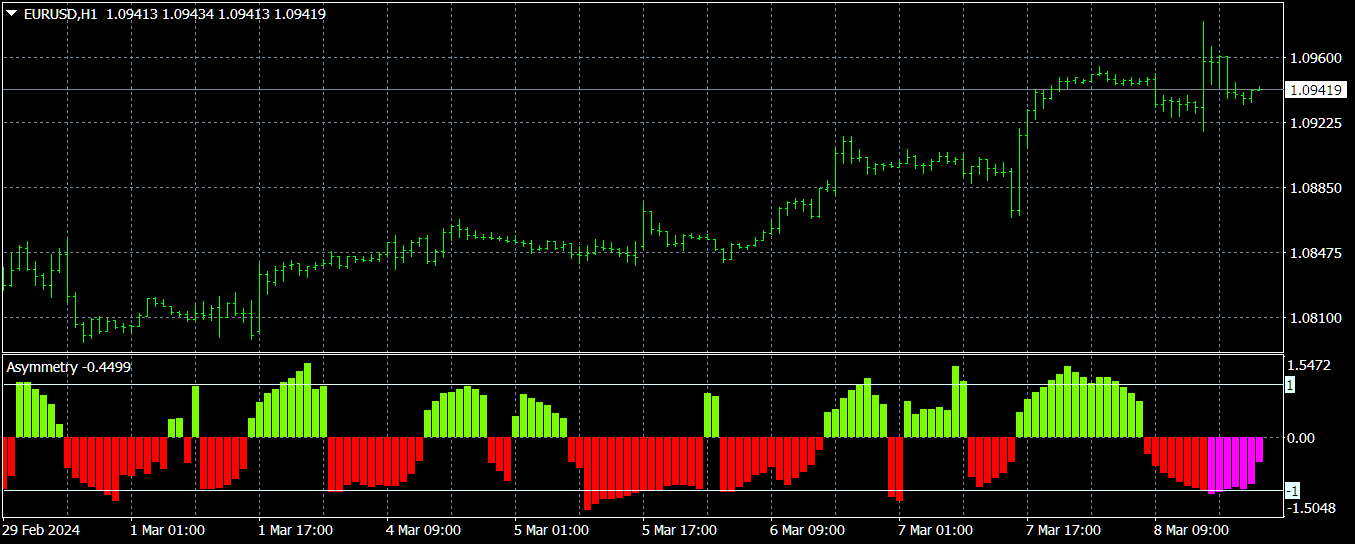
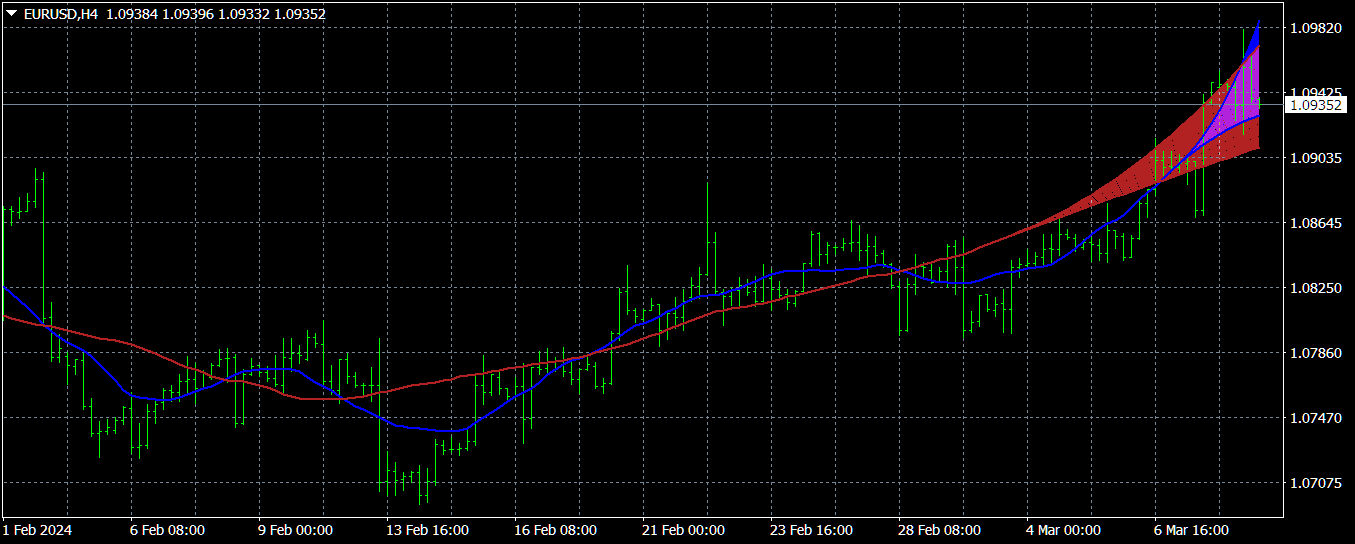
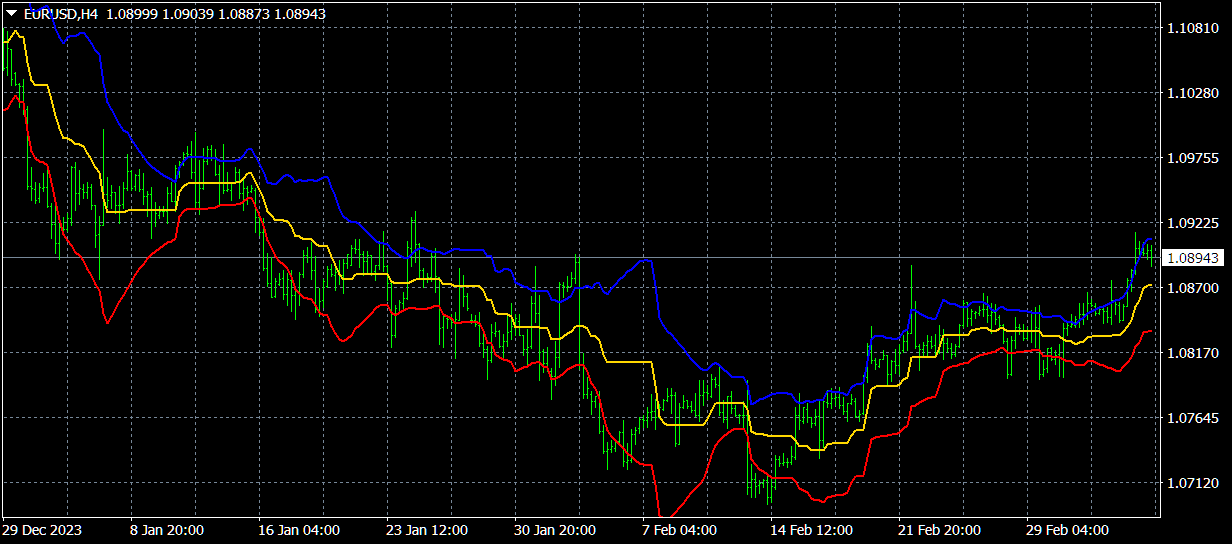
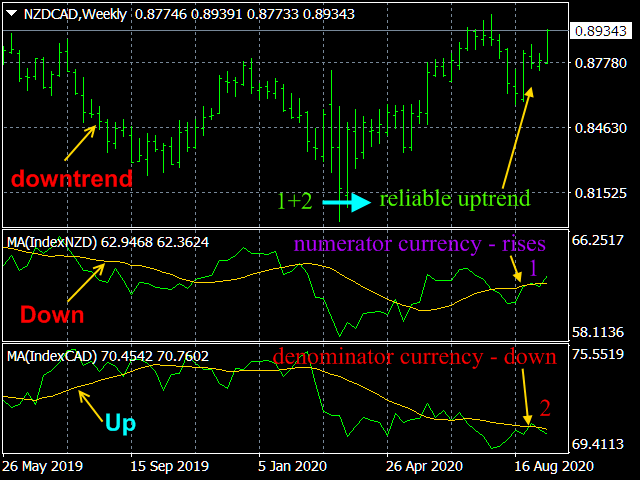
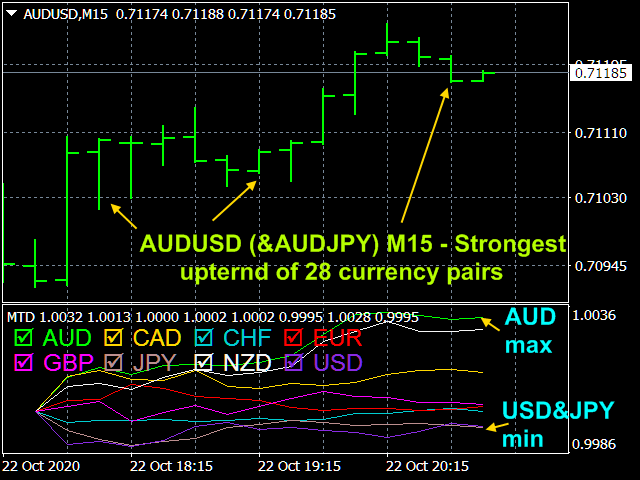
2) 🏆 统计指标(确定全球趋势)。
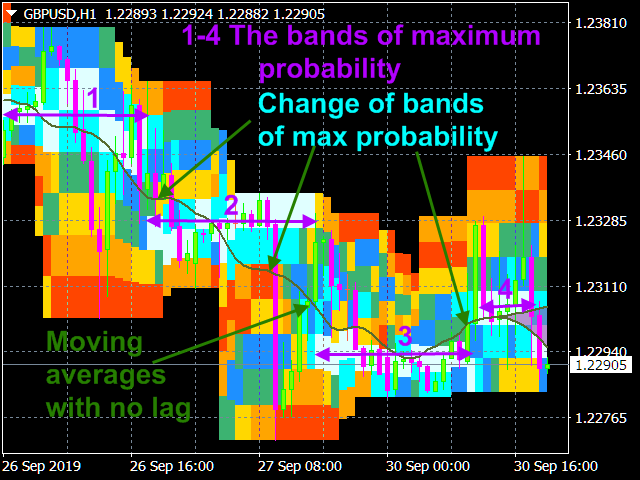
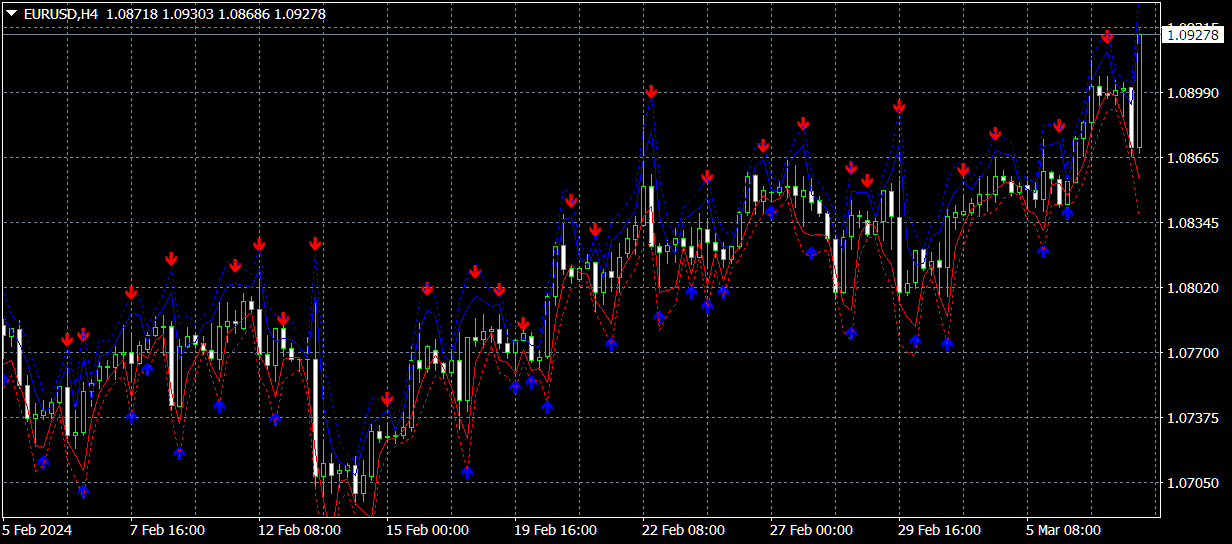
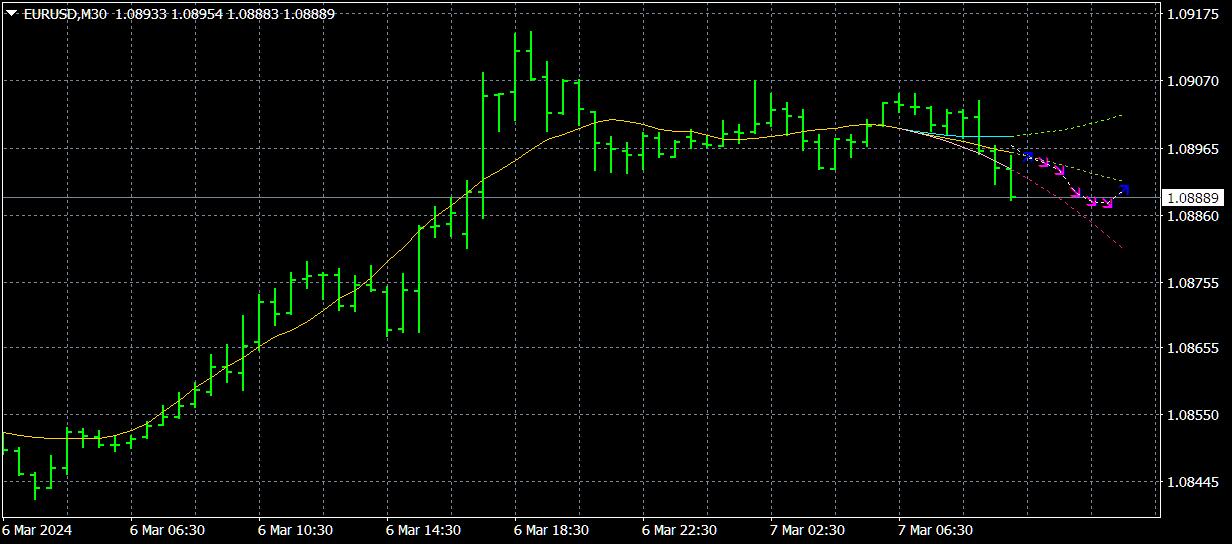
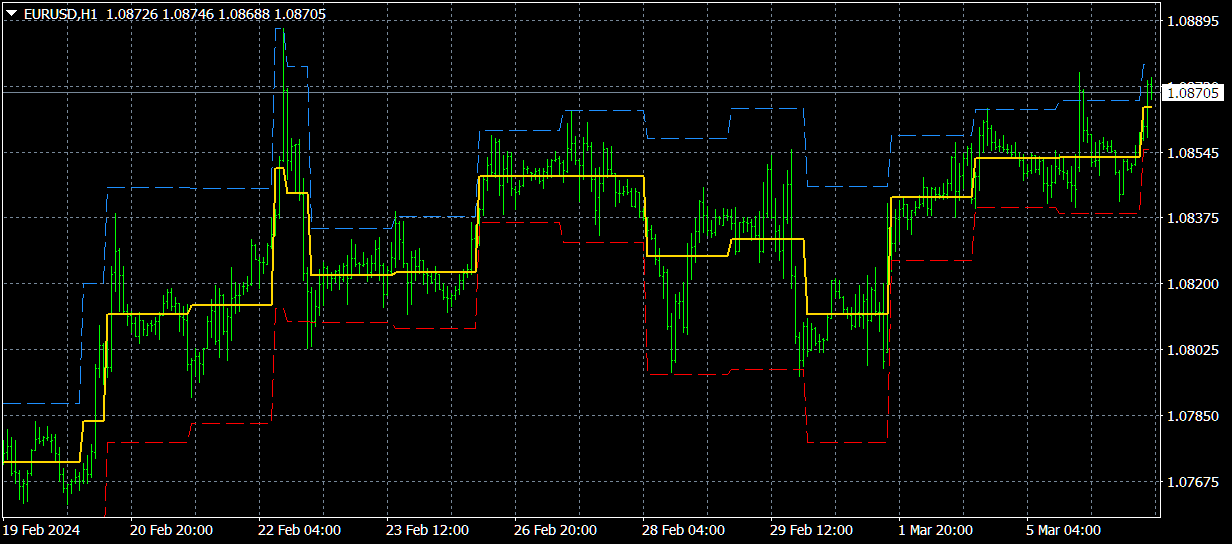
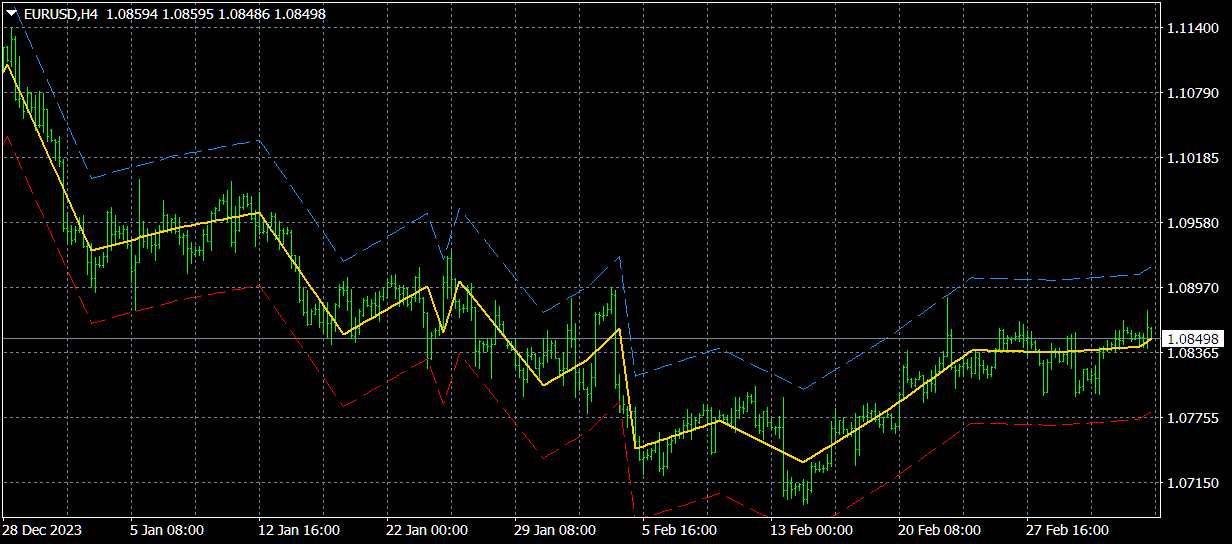
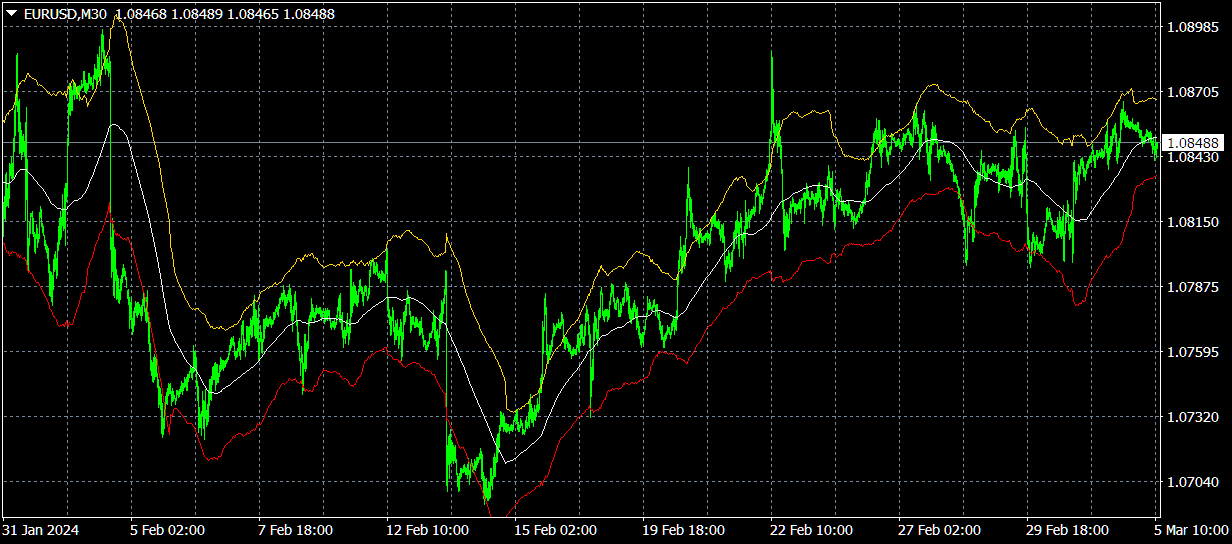
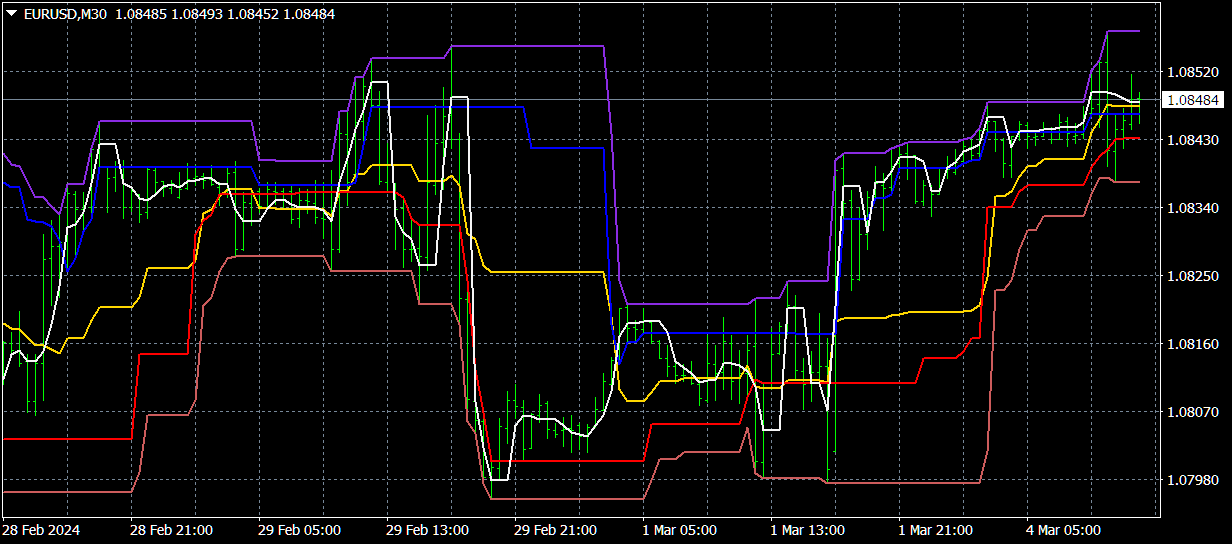
3) 🏆 市场研究指标(以澄清价格的微观结构,建立渠道,识别趋势反转和回调之间的差异)。
---------------------------------------------------------------------------
☛ 博客中的更多信息 https://www.mql5.com/en/blogs/post/741637
Aleksey Ivanov
Aleksey Ivanov
Probabilities distribution of price https://www.mql5.com/en/market/product/27070
Indicator is used for:
3. defining price probability distributions. This allows for a detailed representation of the channel and its borders and forecast the probability of a price appearing at each segment of its fluctuations;
4. defining the channel change moment.
✔️The algorithms of this indicator are unique and developed by their author
✔️ It has built-in management
Author Aleksey Ivanov https://www.mql5.com/en/users/60000382
Aleksey Ivanov
Aleksey Ivanov
Dear friends! The indicator's performance is presented on the latest data. Evaluate his work.

Asummetry https://www.mql5.com/en/market/product/40005
The Asummetry indicator allows you to predict the beginning of a change in the direction of trends, long before their visual appearance on the price chart.
✔️The algorithms of this indicator are unique and developed by their author
Author Aleksey Ivanov https://www.mql5.com/en/users/60000382
Aleksey Ivanov
Aleksey Ivanov
Dear friends! The indicator's performance is presented on the latest data. Evaluate his work.

Strong Trend Flat Signal https://www.mql5.com/en/market/product/37203
The Strong Trend Flat Signal indicator is the intersection of two, developed by the author, non-lagging moving averages with averaging periods 21 and 63.
✔️The algorithms of this indicator are unique and developed by their author
Author Aleksey Ivanov https://www.mql5.com/en/users/60000382
Aleksey Ivanov
Aleksey Ivanov
Friends! What we see on the price charts as a trend is often not a trend, but arises as a result of the imposition of a large number of unidirectional price jumps, i.e. is a purely random occurrence. Such pseudo-trends especially often occur on small timeframes, where the level of noise is very high against the background of a weak regular price movement. And you can win on such random false trends only by chance. Therefore, following such false trends, as a rule, leads to losses. My indicators were designed to filter out such noise, which is not an easy task. For more information about this phenomenon and how to identify it, see the blog «True and illusory currency market trends” https://www.mql5.com/en/blogs/post/740838
Aleksey Ivanov
Aleksey Ivanov
Dear friends! The indicator's performance is presented on the latest data. Evaluate his work.

Probability distribution PRO https://www.mql5.com/en/market/product/41174
Indicator is used for:
1. defining price probability distributions. This allows for a detailed representation of the channel and its borders and forecast the probability of a price appearing at each segment of its fluctuations;
2. defining the channel change moment.
✔️The algorithms of this indicator are unique and developed by their author
Author Aleksey Ivanov https://www.mql5.com/en/users/60000382
Aleksey Ivanov
Aleksey Ivanov
Dear friends! The indicator's performance is presented on the latest data. Evaluate his work.

Signal Envelopes https://www.mql5.com/en/market/product/46593
The Signal Envelopes indicator uses the robust filtering method based on: (1) the moving median Buff0 = < Median> = (Max {x} + Min {x}) / 2 and (2) the averaging algorithm developed by the author Buff1 = <( ) ^ (- 3)> * ( ) ^ 4 based on the moving median. The Signal Envelopes indicator allows you to most accurately and with the minimum possible delay set the beginning of a new trend. The Signal Envelopes indicator can be used both for trading according to scalper strategies, and when using long-term trading strategies.
✔️The indicator has all kinds of alerts.
✔️ The indicator does not redraw
✔️The algorithms of this indicator are unique and developed by their author
Author Aleksey Ivanov https://www.mql5.com/en/users/60000382
Aleksey Ivanov
Aleksey Ivanov
Dear friends! The indicator's performance is presented on the latest data. Evaluate his work.

Signal Channel https://www.mql5.com/en/market/product/50988
The Signal Channel indicator uses a robust filtering method based on two moving medians applicable to the High and Low prices, i.e. the lines and , where <..> is the sign of linear averaging, which are shifted by certain values in an uptrend and by opposite values in a downtrend, which allows you to get a narrow channel, approximately outlining each bar. Sharp kinks of the lines of such a channel allow the most accurate and minimal possible delay to establish the beginning of a new trend movement. The possible change in the direction of the trend is also indicated by sharp narrowing of the channel lines, which, in fact, is expressed by the fall in volatility. The indicator also has an additional filtering function, upon activation of which the signal is identified only after a decrease in volatility, which makes the indicator more reliable. In addition to the main channel, inside which the most probable price fluctuations occur, an auxiliary channel is built (in dashed lines), beyond the borders of which the price does not go anymore, which serves to set stoplosses on it.
✔️ The Signal Channel indicator can be used both for trading according to scalper strategies, and when using long-term trading strategies.
✔️ It has built-in management
✔️ The indicator has all types of alerts.
✔️ The indicator does not redraw.
✔️ One of the best indicators with optimal market noise filtering.
Author Aleksey Ivanov https://www.mql5.com/en/users/60000382
Aleksey Ivanov
Aleksey Ivanov
Dear friends! The indicator's performance is presented on the latest data. Evaluate his work.
Absolute Bands FREE https://www.mql5.com/en/market/product/33826
The Absolute Bands indicator is reminiscent of the Bollinger Bands indicator with its appearance and functions, but only more effective for trading due to the significantly smaller number of false signals issued to them. This effectiveness of the Absolute Bands indicator is due to its robust nature.
✔️ One of the best indicators with optimal market noise filtering.
Author Aleksey Ivanov https://www.mql5.com/en/users/60000382
Aleksey Ivanov
Aleksey Ivanov
Dear friends! The indicator's performance is presented on the latest data. Evaluate his work.
StatPredict https://www.mql5.com/en/market/product/38721
✔️The indicator predicts the price in accordance with the prevailing trend and its own small statistical price fluctuations around this trend. Using mathematical methods for predicting random processes, StatPredict indicator predicts the most probable values of the future price and calculates the confidence interval for them.
✔️StatPredict also provides the option to calculate the lot, based on the positions of the last points of the calculated channel of confidence probability, as well as the size of the deposit and the allowable risk, which are specified in the indicator settings.
✔️The algorithms of this indicator are unique and developed by their author
Author Aleksey Ivanov https://www.mql5.com/en/users/60000382
Aleksey Ivanov
Aleksey Ivanov
Dear friends! The indicator's performance is presented on the latest data. Evaluate his work.

Velocity of price change https://www.mql5.com/en/market/product/62315
The Velocity of price change indicator shows the average rate of price change at those characteristic time intervals where this rate was approximately constant. The robust algorithm used in Velocity of price change to smooth out the price from its random jumps, ensures the reliability of the indicator reading, which does not react to simple price volatility and its insignificant movements.
✔️The algorithms of this indicator are unique and developed by their author
Author Aleksey Ivanov https://www.mql5.com/en/users/60000382
Aleksey Ivanov
Aleksey Ivanov
Absolute price https://www.mql5.com/en/market/product/54630
✔️ This indicator is intended for professionals assessing fundamental market trends. This indicator calculates the index of any instrument and analyzes it.
✔️ The indicator has modes for analyzing the indices themselves, namely: Moving Average; Relative Strength Index; Momentum; Commodity Channel Index; Bollinger Bands; Envelopes.
Author Aleksey Ivanov https://www.mql5.com/en/users/60000382
Aleksey Ivanov
Aleksey Ivanov
Dear friends! The indicator's performance is presented on the latest data. Evaluate his work.

TrueChannel FREE https://www.mql5.com/en/market/product/61769
The TrueChannel indicator shows us the true price movement channels. This indicator resembles Donchian Channel in its appearance, but is built on the basis of completely different principles and gives (in comparison with Donchian Channel, which is better just to use to assess volatility) more adequate trading signals.
✔️The algorithms of this indicator are unique and developed by their author
Author Aleksey Ivanov https://www.mql5.com/en/users/60000382
Aleksey Ivanov
Aleksey Ivanov
StatZigZag https://www.mql5.com/en/accounting/buy/market/61091?period=0 - One of the most accurate non-redrawing indicators that filters out random market noise. Buy this indicator and you are guaranteed success in the financial and stock markets.
The StatZigZag indicator looks like a regular ZigZag, but is built on the basis of completely different algorithms. The StatZigZag indicator is a broken line built from segments of regression lines of different lengths, the beginning of each of which comes from the end of the previous segment. Each regression segment is built until the variance or spread of price around it begins to exceed a certain critical value, after which the construction of this segment ends and the construction of the next segment begins. This approach is due to the following. The variance of the price around the regression segment begins to grow strongly with large price jumps and with an increase in its volatility, which take place when the trend movement changes. This allows the broken line resulting from the operation of this algorithm to track the trend and the moments of its reversals.
The number of points for plotting each segment of the regression line is variable and depends on the market situation described by the indicator, but it can vary from Backstep to Depth, which are set in the indicator settings. At the same time, the smaller the Backstep, the smaller the delay with which the beginning of the trend movement is determined and the greater the resolution of the nearest price peaks. However, low Backstep values also reduce the reliability of the results. Decreasing Depth allows a trader to identify areas with a different average rate of price change on long trends.
The StatZigZag indicator also builds a channel of maximum price fluctuations around the broken regression line, on the lower (red) line of which you can set StopLoss for buy orders, and on the upper (blue) line - StopLoss for sell orders.
The indicator is resource-intensive, therefore it is recommended to reduce the number of displayed bars in the window, especially in the tester mode.


Using the StatZigZag indicator in trading.
The StatZigZag indicator, being the most optimal filter, does not react to simple price volatility and its insignificant movements. However, the last regression line of the StatZigZag indicator, like the ZigZag indicator, is redrawn. Therefore, StatZigZag is, first of all, an auxiliary tool for technical analysis, i.e. StatZigZag, just like a regular ZigZag, is best used to study the price chart - more accurate trend establishment, determination of support and resistance levels, clearer identification of various technical analysis patterns, Eliot waves, etc.
Meanwhile, StatZigZag draws a broken line not according to individual single peaks and valleys (as a regular ZigZag does), which may have the character of strong unlikely price jumps, but based on the statistics of a large set of points. Therefore, StatZigZag readings are more reliable and it redraws the last segment of the regression line to a much lesser extent than redraws the last knee of the classic ZigZag. Moreover, many ZigZag modifications do not draw the last knee at all until the criteria of the last extremum are reached. Meanwhile, the more (for a greater number of bars) the last segment of the StatZigZag indicator is drawn, the less this segment begins to redraw, then acquiring the status of a reliable signal to open a position. For this reason, StatZigZag can be used directly as a signal provider or for opening positions. In addition, the channel, also drawn by the StatZigZag indicator, allows you to reliably place StopLoss positions.

Guaranteed success https://www.mql5.com/en/accounting/buy/market/61091?period=0
Aleksey Ivanov
Aleksey Ivanov
Friends, I am a theoretical physicist and a trader, mathematically rigorously studying market processes, aspects of which I have already begun to present in my articles. https://www.mql5.com/en/articles/10955
https://www.mql5.com/en/articles/11158
https://www.mql5.com/en/articles/12891
Based on a rigorous theory, I have developed indicators with optimal market noise filtering for trading. https://www.mql5.com/en/blogs/post/741637
However, it should be emphasized that a trader (investor) should choose the direction of his positions on the basis of fundamental analysis, and correctly applied indicators of optimal filtering of market noise should be only its auxiliary tool. These indicators are used to determine:

(4) market entry points are determined,
(5) the positions of stop-loss and profit and their order (time and number of points) of movement are determined,
(6) determine the size of the opened lots (calculated through money management built into the work of many indicators presented here).

I emphasize that for today's highly volatile market, these (1-3) statistically calculated parameters of the game are also (like fundamental analysis) key, in the sense that without them it will be generally impossible to get a stable profit.

Subscribe to my channel and you will be aware of my latest developments in the field of trading
https://www.mql5.com/en/channels/statlab
Aleksey Ivanov
Aleksey Ivanov
Dear friends! The indicator's performance is presented on the latest data. Evaluate his work.

Identify Trend FREE https://www.mql5.com/en/market/product/36336
Identify Trend well-known popular indicator with optimal market noise filtering.
✔️The indicator has all kinds of alerts.
✔️The algorithms of this indicator are unique and developed by their author
Author Aleksey Ivanov https://www.mql5.com/en/users/60000382
Aleksey Ivanov
Aleksey Ivanov
Casual Channel https://www.mql5.com/en/accounting/buy/market/71806?period=0 - One of the most accurate non-redrawing indicators that filters out random market noise. Buy this indicator and you are guaranteed success in the financial and stock markets.
The trends that you see on the charts are not always trends or, more precisely, trends on which you can make money. The point is that there are two kinds of trends: 1) true trends that are caused by fundamental economic reasons that are stable and, therefore, can provide a reliable profit for the trader; 2) and there are false trend sections that only look like a trend and arise due to chains of random events - moving the price (mainly) in one direction. These false trend sections are short and can reverse their direction at any time (and, as a rule, reverse immediately after their identification); therefore, making money on them (not by chance) is impossible. Visually true and false trends are indistinguishable at the beginning. Moreover, random price movements or the false trends they generate are always superimposed on true trends, which, in particular, can create pullbacks in true trends that need to be identified and distinguished from reversals caused by new fundamental economic causes.
The Casual Channel indicator distinguishes between these two types of trends by plotting a random walk channel of the price. If you attach this indicator to the charts of currency pairs, then these charts, as a rule, will be entirely inside the channel of random walks, within which many trend sections (but not all) are false. At the same time, the price will move from one channel border to another only touching the channel borders. If you attach the Casual Channel to the charts of indices, CFDs, or stocks on large timeframes, then in some cases you may find that their quotes in sufficiently long periods fall outside the random walk channel, namely at the top of the channel in an uptrend and below in a downtrend. In these cases, we have true trends and the higher the chart is above the upper line or below the lower line of the Casual Channel indicator, the stronger the true trend, which can be considered identified if the chart follows approximately one of the indicator lines.

When opening a buy position on a true uptrend, StopLoss should be placed on the lower line of the indicator, and when opening a sell position on a downtrend, StopLoss should be placed on the upper line of the indicator. In this case, the imposition of false trend sections or random price movements on the true trend, which manifest themselves as rollbacks, will not trigger StopLos, which will only work when the trend reversals. However, CFD trends grow very slowly, and pullbacks during this growth, as a rule, greatly exceed the growth itself, which makes a purely trending strategy low-profit and high-risk.
If there is a trend on a shorter timeframe (on which you open a position), then the price moving away from the channel border on a larger timeframe towards this trend will most likely reach the moving average line in this channel, where then you need to set a take profit. If the price on a larger timeframe following a trend set on a smaller timeframe has moved away from the moving average along the trend, then it will reach the opposite border of the large channel, on which a take-profit must be set, since the boundaries of the random walk channel are calculated very accurately.

Guaranteed success https://www.mql5.com/en/accounting/buy/market/71806?period=0
Aleksey Ivanov
Aleksey Ivanov
The Multicurrency Trend Detector https://www.mql5.com/en/accounting/buy/market/56194?period=0 - One of the most accurate non-redrawing indicators that filters out random market noise. Buy this indicator and you are guaranteed success in the financial and stock markets.
The Multicurrency Trend Detector( MTD) indicator allows you to immediately and on one chart on a selected time interval (extending from a zero bar to a bar set in the settings by the value horizon) determine the presence, direction and strength of trends in all major currencies, as well as assess the reliability of these trends.
This is achieved by calculating indices (non-relative purchasing power) of eight major currencies, namely: AUD, CAD, CHF, EUR, GBP, JPY, NZD and USD, of which 28 currency pairs are composed, the states of which are easily estimated by such indices. At the same time, the Index (X) indices of these currencies X are reduced to one at the horizon point, i.e. the graph displays the values of the reduced index Index (X, t)/Index (X, horizon), which allows one graph to easily correlate with each other the evolution of indices of all currencies that originate there from a single point on the horizon.
If, for example, such an index of currency X on this chart rises the most, and the index of currency Y, on the contrary, falls the most, then the currency pair X/Y will grow the fastest in a given time interval. Moreover, the trends of currency pairs in which the index of one of the currencies falls, and the index of another currency is growing, are the most stable.
The indices of these major currencies are calculated based on the USDX dollar index, which is determined by the standards adopted by the Intercontinental Exchange( ICE), where this index is calculated as a geometric weighted average of these currencies using the formula:
USDX= 50.14348112 * USDEUR^(0.576) * USDJPY^(0.136) * USDGBP^(0.119) * USDCAD^(0.091) * USDSEK^(0.042) * USDCHF^(0.036),
showing the value of the US dollar against a basket of six major currencies: the euro (EUR), the yen (JPY), the pound sterling (GBP), the Canadian dollar (CAD), the Swedish krona (SEK), and the Swiss franc (CHF).
For the indicator to work, you need to load the history (Tools / History Center) of quotes EURUSD, USDJPY, GBPUSD, USDCAD, USDSEK and USDCHF.
The information display chart for each currency has its own "check-box", which, for the convenience of analysis, can both hide the corresponding currency and display it.
In addition, the indices can be averaged with a moving average.

Using the indicator in trading.
Since the indexes of currencies reflect the true economic conditions of the respective states, the growth of the index indicates the growth of the economy, and the fall - of the fall, which expresses true or reliable trends. Therefore, if the Index (X) of currency X in a currency pair X/Y rises, and Index (Y) of currency Y falls, then this is the most reliable signal to buy X/Y. The indicator allows you to immediately visually identify the fastest growing currency and the fastest falling currency, which allows you to instantly see (at a given time interval) the pair with the strongest trend out of many (28 pieces) currency pairs. The trends of currency pairs arising from the joint growth of their constituent currencies or their joint fall are extremely unstable and subject to large and unpredictable random fluctuations.
In addition, the indicator on a given time interval easily identifies similarly changing currencies X, Z, etc., which allows you to compose such portfolios of currency pairs X/Y, Z/X, etc. in which separate multidirectional price fluctuations will compensate each other, reducing drawdowns.


Guaranteed success https://www.mql5.com/en/accounting/buy/market/56194?period=0
Aleksey Ivanov
Aleksey Ivanov
Friends! The foreign exchange market in our time is an absolute chaos. If you play on the foreign exchange market, then you should treat it exactly like a game, i.e. it is the same as playing in a casino. Don't expect this game to be your main source of income. These are false hopes. Therefore, play for extra money. In no case do not play with borrowed money from someone (banks, friends, etc.). This will lead to disaster.

There is a little more order in the stock market than in the foreign exchange market. Here you can rely on fundamental data on the economic condition (financial statements, etc.) of the companies that issue the respective shares. But here, in our time, when the global crisis is approaching, the data provided by even reputable experts can be unreliable. However, the indicators I provide are better applied to the stock market, which is more orderly.

Modern profitable indicators https://www.mql5.com/en/blogs/post/741637
Author Aleksey Ivanov https://www.mql5.com/en/users/60000382
Aleksey Ivanov
Aleksey Ivanov
Profit Trade https://www.mql5.com/en/accounting/buy/market/49806?period=0 - One of the most accurate non-redrawing indicators that filters out random market noise. Buy this indicator and you are guaranteed success in the financial and stock markets.

The benefits of the indicator.
The indicator demonstrates the current state of the market in a clear and covering all characteristic price scales. The filtration used in Profit Trade is extremely robust; and this indicator does not redraw. The indicator settings are extremely simple.

Trading with the Profit Trade Indicator.
The upper Dup and lower Ddn lines cover all the current price fluctuations for the period n1 and outline a large-scale channel. Price breaks through this large-scale channel as market conditions change. If an uptrend occurs, then the price will almost always fit into the narrow channel formed by the Dup and Pup lines. When a downtrend occurs, the price is clamped into a narrow channel by the lines Ddn and Pdn. With the continuation of trends arising from breakdowns of a large-scale channel, the signal line Ps will always go through the middle of such ascending or descending channels. If the signal line Ps crosses the Pup line in the ascending channel from top to bottom or crosses the Pdn line in the descending channel from bottom to top, this indicates a change in direction of the corresponding trend. Further intersection by the signal line Ps of the midline Dm confirms the emerging trend. An earlier signal for a change in the direction of the trend is a sharp bend in the signal line Ps, when it from the direction parallel to the horizontal becomes directed against the established trend. If the signal line, being horizontal at first, bends in the direction of the trend, then this trend will continue. If the trend is upward and starts when you exit the lower channel limited by the Ddn and Pdn lines, then StopLoss of a buy position must be placed on the Ddn line. For a downtrend starting from the channel Dup and Pup, StopLoss of the sell position must be placed on the Dup line.
When the signal line Ps crosses the Pup line in the upstream channel from the top down or crosses the Pdn line in the downward channel from the bottom up, this may also indicate a rollback on the corresponding trend. Profitable positions in this case must be closed; and wait until Ps crosses the Pup line in the upstream channel from the bottom up or crosses the Pdn line in the down channel from the top down, which will indicate the completion of the rollback. Then again we open positions according to the trend. StopLoss in this case is also defined as previously described, but on a smaller timeframe.
The flat is identified by long, horizontal indicator lines that are comparable in length with trend areas. Opening positions on the flat is undesirable.
An analysis of the state of the market should begin with a consideration of a large time frame, which determines the direction of the current trend. If flat, it is better not to open positions. We open positions according to the trend on a smaller timeframe. If there is a pullback, then the corresponding position against the trend is also undesirable to open, because at the time of the rollback, we do not know its duration, which may turn out to be small.


Indicator Settings.
§ The main averaging period - Any positive integer (20 default).
§ The signal line averaging period - Any positive integer (3 default).
§ Line thickness - Any positive integer (1 default).


Guaranteed success https://www.mql5.com/en/accounting/buy/market/49806?period=0
Aleksey Ivanov
Aleksey Ivanov
Identify Market State https://www.mql5.com/en/accounting/buy/market/46028?period=0 - One of the most accurate non-redrawing indicators that filters out random market noise. Buy this indicator and you are guaranteed success in the financial and stock markets.
The Identify Market State indicator allows you to set the beginning of a new trends and pullbacks on an existing trend. This indicator can be used both for trading on scalper strategies and for long-term trading strategies.
The indicator is based on the 14 periodic DeMarker indicator and the 8 periodic simple moving average from this indicator. Statistical studies have shown that the sharp peaks of the DeMarker indicator curve when they drop below its minimum line (oversold zone) or when they exceed its maximum line (overbought zone), indicate possible rollback points (which do not exclude the continuation of the same trend movement). Going beyond the same extreme lines of intersection of the DeMarker indicator line with the average from this indicator determine the beginning of new trends.
Possible moments of a change in trend direction and pullbacks are indicated by different arrows. The option to display these signals on the main chart by vertical lines is provided.
The indicator does not redraw. The indicator has all types of alerts.

Indicator settings.
§ DeMarker Period. – The averaging period of DeMarker indicator. Values: any positive integer (14 default).
§ Max level. – Maximum level of DeMarker (0.7 default).
§ Min level. – Minimum level of DeMarker (0.3 default).
§ DeMarker color. - Line color of DeMarker. (Magenta default).
§ DeMarker width. - Line thickness of DeMarker. (1 default).
§ MA Period. - Moving Average Period by DeMarker. Values: any positive integer (8 default).
§ The averaging method - DeMarker indicator curve averaging method. Values: Simple (default), Exponential, Smoothed, Linear weighted.
§ MA Color. – Moving average color from DeMarker. (Gold default).
§ MA Width. - Moving average line thickness from DeMarker. (1 default).
§ Arrows Buy Color – Arrow color for buy. (YellowGreen default).
§ Arrows Sell Color - Arrow color for sale. (Red default).
§ Arrows Width. - Arrow thickness. (1 default).
§ Show rollback signals. Values: true (default), false.
§ Show trending sell and buy signals. Values: true (default), false.
§ Show vertical lines. – Show vertical lines of signals on the main chart. Values: true, false(default).
§ The Signal method - Type of trading signal alert. Values: No (default), Send alert, Print (in expert), Comment (in chart), Sound + Print, Sound + Comment, Sound, Push + Comment, Push, Mail + Comment, Mail.

Guaranteed success https://www.mql5.com/en/accounting/buy/market/46028?period=0