MetaForecast M4
- 指标
- Vahidreza Heidar Gholami
- 版本: 1.6
- 更新: 21 九月 2023
- 激活: 10
MetaForecast能够根据价格数据中的谐波来预测和可视化任何市场的未来走势。虽然市场不总是可预测的,但如果价格中存在模式,MetaForecast可以尽可能准确地预测未来。与其他类似产品相比,MetaForecast通过分析市场趋势可以生成更精确的结果。
输入参数
Past size (过去的尺寸)
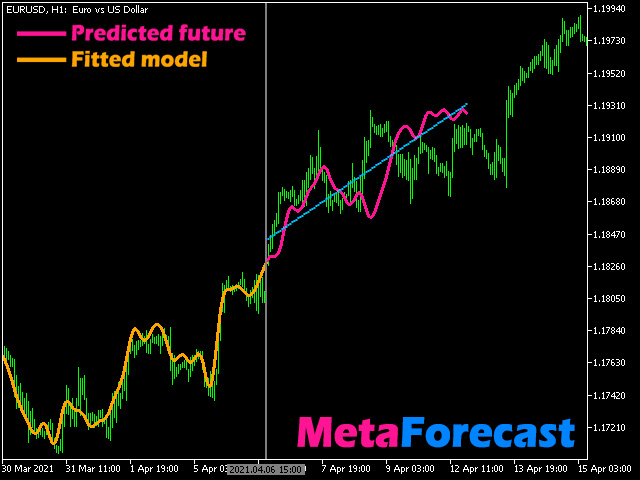
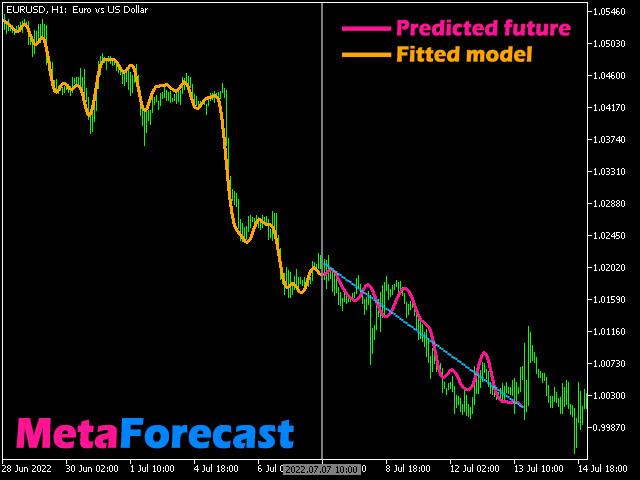
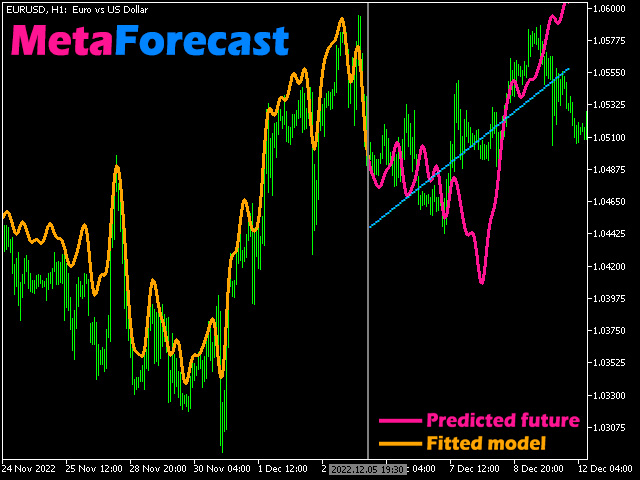
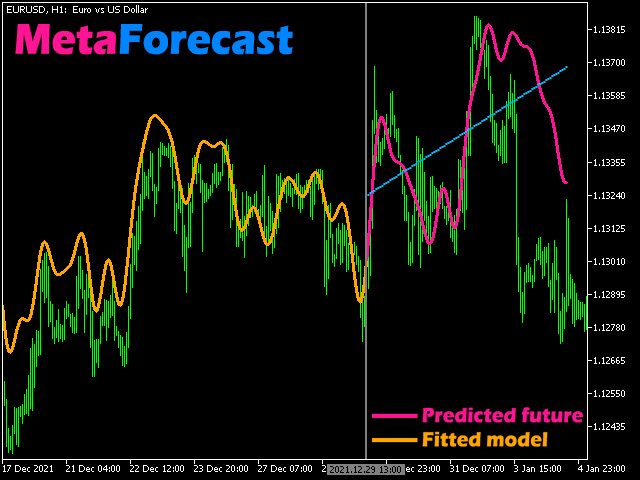
指定MetaForecast用于创建生成未来预测模型的柱数量。该模型以一条黄色线绘制在所选柱上。
Future size (未来的尺寸)
指定应预测的未来柱数量。预测的未来以粉色线表示,并在其上绘制了蓝色回归线。
Degree (程度)
此输入确定了MetaForecast将在市场上进行的分析级别。
| Degree | 描述 |
|---|---|
| 0 | 对于程度0,建议使用较大的值来设置“过去的尺寸”输入,以覆盖价格中的所有高峰、低谷和细节。 |
| 1 (建议的) | 对于程度1,MetaForecast可以理解趋势,并通过较小的“过去的尺寸”生成更好的结果。 |
| 2 | 对于程度2,除了趋势,MetaForecast还可以识别反转点。对于大于1的程度,必须使用较高的“细节”和“噪音减少”输入值。 |
| 大于2 | 不建议使用大于2的程度,但可以尝试。 |
Details (细节)
指定用于生成预测的价格数据中应提取的细节百分比。较高的值需要较长的处理时间。
Noise Reduction (噪音减少)
当使用大于1的程度时,MetaForecast需要对输入数据进行噪音减少,以创建一个合适的模型。例如,对于程度为2,将噪音减少设置为90%。为了获得更好的结果,增加细节到20%。
Remove jumps (移除跃变)
有时,尤其是对于大于1的程度,预测结果中会出现较大的跃变。启用此输入可以纠正预测的形状。
Regression lines (回归线)
MetaForecast在预测的柱上绘制回归线,以使趋势更清晰。使用此输入来指定回归线的数量。
Calculate per n bars (每n根柱计算)
使用此输入设置两次预测之间的间隔。例如,如果将其设置为100,这意味着它在预测未来后会暂停100根柱,然后进行下一次预测。
MetaForecast使交易员能够预测价格历史中的未来价格走势,从而使他们能够将结果与实际未来价格进行比较。要使用此功能,请在键盘上按下 "H" 键以查看垂直线,您可以将其移动以将预测带入历史价格,而不是当前的蜡烛图。要浏览历史记录,按住 "Ctrl" 键并移动鼠标以移动垂直线。要返回到当前的蜡烛图,再次按下 "H" 键。如果您的图表上有多个MetaForecast并且需要同时重置它们,请在键盘上按下 "R" 键。
我一直在探索新的方法来预测市场的未来走势。每当我发现一种新的有效方法或算法,我都会将其纳入产品中。我非常感谢您的支持,这将使我能够继续开发这一独特的产品。


There are definitely improvements to be made, but not bad for starters.