Order Blocks ICT Multi TF MT5
- 指标
- Diego Arribas Lopez
- 版本: 1.3
- 更新: 26 十一月 2023
- 激活: 10
MT4 Version Kill Zones SMT Divergences
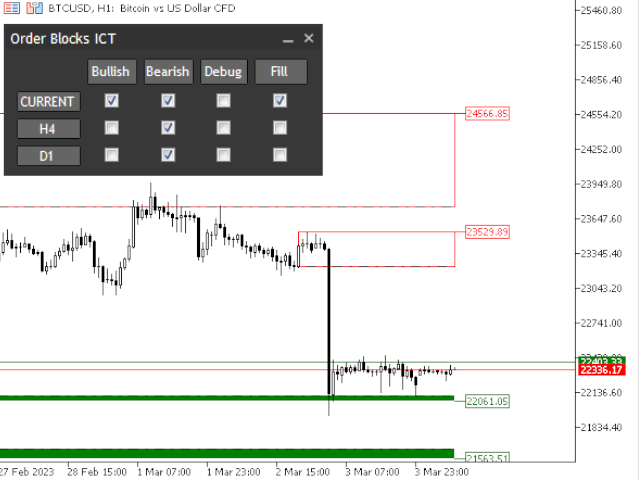
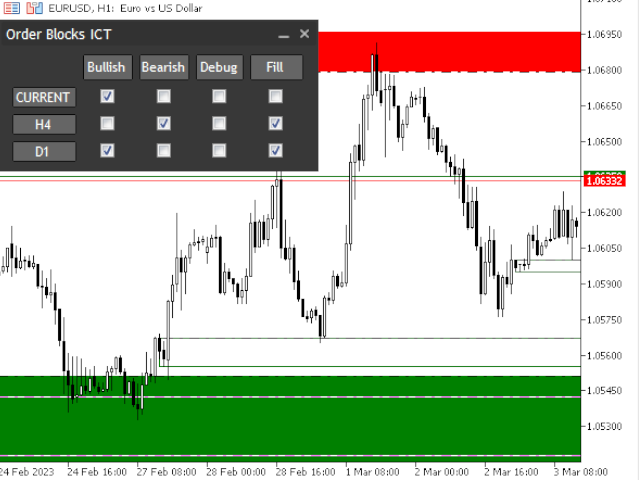
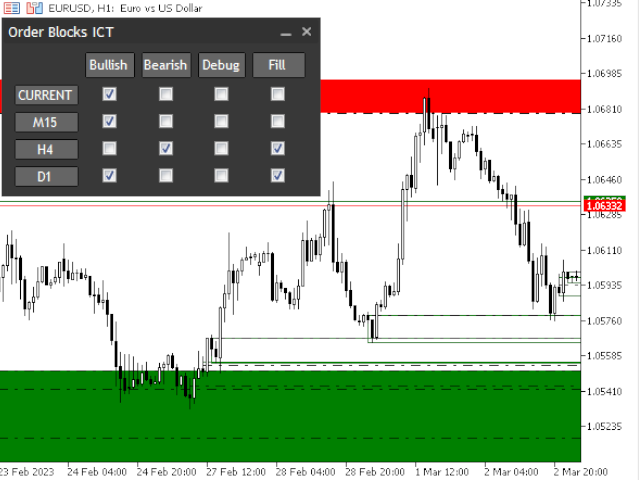
Order Blocks ICT Multi TF
The Order Blocks ICT Multi TF indicator is a cutting-edge tool designed to help traders make better trading decisions based on order block analysis. Order blocks are key levels on a price chart where large institutional traders placed their orders. These levels tend to act as strong support or resistance zones and often signal a potential reversal or continuation of a trend. By identifying these order blocks, traders can gain valuable insight into market trends and make more informed trading decisions. The Order Blocks ICT Multi TF indicator uses a multi-timeframe analysis approach, allowing traders to identify order blocks at multiple timeframes. This provides traders with a comprehensive view of the market trends, increasing the accuracy of their trading decisions.
Please note that the UI in the strategy tester may be laggy. However, we assure you that this is only a testing environment issue and that the indicator works perfectly in the real product.
The user interface of the Order Blocks ICT Multi TF trading indicator is designed to be easy to use and interactive. Traders can customize the settings to their specific trading style and preferences, making it a versatile tool for traders of all levels.
In addition, the indicator features a sophisticated alerts and notifications system, allowing traders to set up custom alerts for specific events or price levels. This ensures that traders never miss an opportunity to enter or exit a trade based on order block analysis.
Overall, the Order Blocks ICT Multi TF trading indicator is a must-have for any serious trader looking to improve their trading performance. By analyzing order blocks, traders can gain valuable insight into market trends and make more informed trading decisions. The multi-timeframe analysis, easy-to-use interface, and sophisticated alerts and notifications system make this indicator an essential tool for traders of all levels.
The main characteristics of the indicator are the following:
- Time saving
- Highly customizable
- Functional on all pairs (Cryptos, Forex, Stocks, Indices, Commodities, etc.)
- Perfect for Scalping or Swing trading
- Highlights possible market reversal zones
- Highlights banks and institutions activity
- Sophisticated alerts and notifications system


Looks good, give 5 star for now, Author can you check my MT4 comment to improve the alert to split to 3 alert (on zone create, on re-touch, on zone break) + add 1 more option to allow us set the minimum zone width very important so we don't miss opportunity, please check the comment and let us know please implement ok? also it doesn't work on renko offline chart nothing display please fix this issue also ok Author? please check the MT4 comment page I posted your ict order block on renko offline chart but not working, please help fix ok? *once you fix i'll update the review again* Thanks alot :)